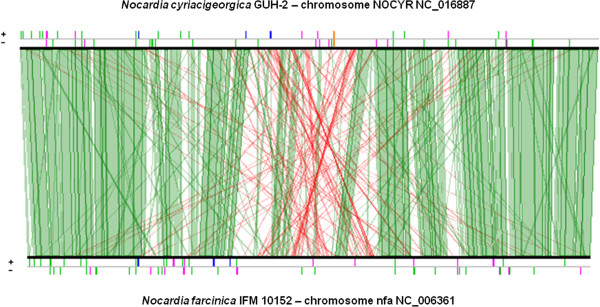
Figure 6.

Lineplot based on conserved synteny results (≥ 5 CDS) between N. cyriacigeorgica and N. farcinica genomes. Strand conservations (in green) and strand inversions (in red) are shown. Above the lineplot, orange bar indicates approximate terminus replication location and pink bars indicate transposases and insertion sequences. Blue bars indicate rRNA and green ones tRNA.
