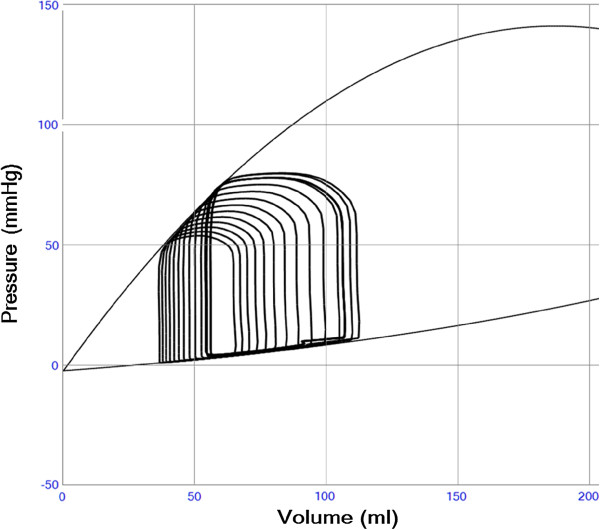
Figure 2.

Left ventricular pressure-volume loops during a preload reduction maneuver in a case with slightly reduced left ventricular function (Emax 1.4 and Emin 0.08). The diastolic and end-systolic pressure-volume relations are shown in thin black lines. The end-systolic line is curved due to the “heart law of Starling” reducing contractile strength during volume overload according to Additional file 2: Equation S2. The curved end-diastolic relation illustrates the increase in passive stiffness when the ventricle is dilated according to Additional file 2: Equation S3.
