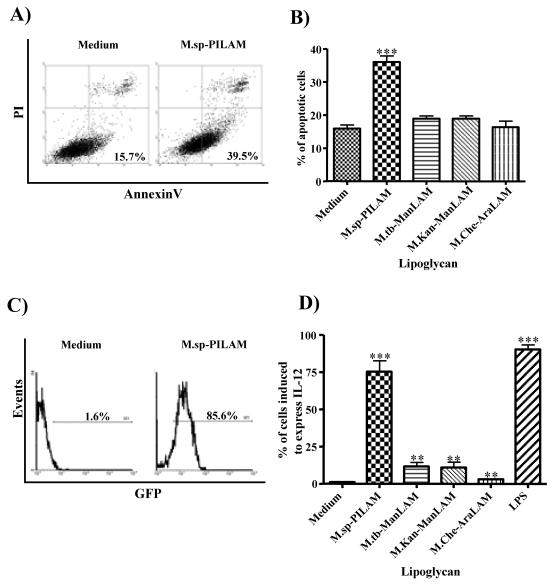
FIG. 2.
PILAM induces apoptosis and IL-12 gene expression in macrophages. (A) Differentiated human THP-1 cells either were not treated (left panel) or were incubated with PILAM (20 μg/ml) for 24 h and then stained with AnnexinV-Alexa488 and propidium iodide and analyzed by flow cytometry to determine the induction of apoptosis. (B) Percentage of apoptotic THP-1 cells treated with different LAM molecules which are representative of the three LAM families (ManLAM, PILAM, and AraLAM) and were isolated from various mycobacterial species. The percentage of apoptotic cells was determined as the number of AnnexinV-Alexa488-positive and propidium iodide-negative cells in a population of 10,000 cells analyzed by flow cytometry. M.sp.-PILAM, Mycobacterium sp. PILAM; M.tb-ManLAM, M. tuberculosis ManLAM; M.Kan-ManLAM, M. kansasii ManLAM; M.Che-AraLAM, M. chelonae AraLAM. (C) RAW cells transfected with an IL-12p40 gene promoter-GFP gene fusion plasmid (RAW/pIL-12-GFP) either were not treated (left panel) or were treated with 20 μg of PILAM per ml (right panel) for 16 h. Activation of the IL-12p40 promoter was determined by flow cytometry analysis of 5,000 events per condition, and the percentage of GFP-positive cells is indicated. (D) Induction of IL-12 expression by different lipoglycans analyzed as described above. The percentages of cells induced to express IL-12 are indicated. For panels B and D the means and standard deviations for three to five experiments are shown, and statistical analyses were performed by using the unpaired t test to compare treated cells to untreated cells; three asterisks indicate that the P value is <0.001, and two asterisks indicate that the P value is <0.01.

