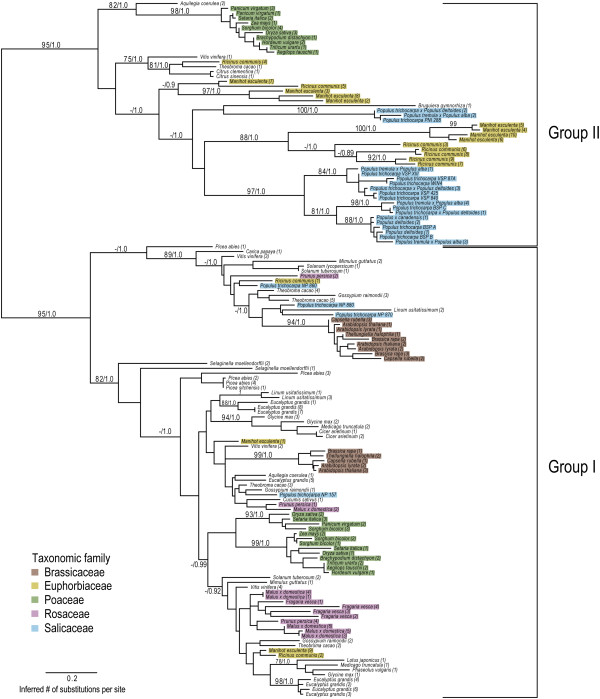
Figure 7.
Phylogenetic analyses of NP-like proteins in the plant kingdom. Phylogenetic relationships were constructed using Bayesian and maximum-likelihood methods. Numbers at branches indicate posterior probabilities and bootstrap percentages based on 1000 replicates, respectively. Numbers in parentheses correspond to Phytozome or NCBI sequence identifiers, which can be found in the Additional file 7: Table S4. The five predominant taxonomic families are indicated by the highlighted colors.

