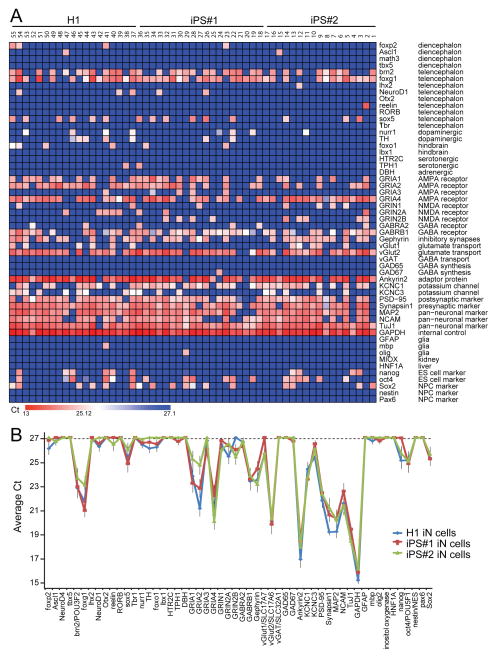
Figure 3. iN cell generation involves reproducible changes in gene expression.
A, Single-cell quantitative RT-PCR analysis (Fluidigm) of the expression levels of the genes indicated on the right. Expression levels (expressed as Ct values) are color coded as shown on the bottom. mRNA levels were quantified in cytoplasm aspirated from individual iN cells using patch pipettes after 3 weeks of induction.
B, Comparison of gene expression profiles in iN cells differentiated from H1 ES and two different lines of iPS cells. The plot depicts average Ct values of the genes indicated at the bottom, with a cutoff of 27 cycles (on top of the 18 cycle pre-amplification).
For more extensive analyses of further marker genes, see Fig. S3.

