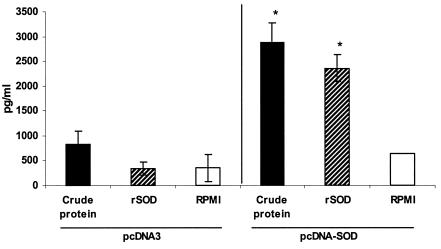
FIG. 2.
Quantitative ELISA analysis of IFN-γ secreted by lymphocytes upon stimulation with different antigens. Spleen cells (4 × 10⁶/ml) from mice inoculated with pcDNA3 or pcDNA-SOD were stimulated with CBPs (4 μg/ml), rSOD (0.4 μg/ml), or RPMI 1640 (negative control) for 48 h. Each bar represents the geometric mean ± standard deviation (error bars) of the responses in spleen cells from five individual mice. *, statistically significant differences compared to RPMI 1640 (P ≤ 0.07).

