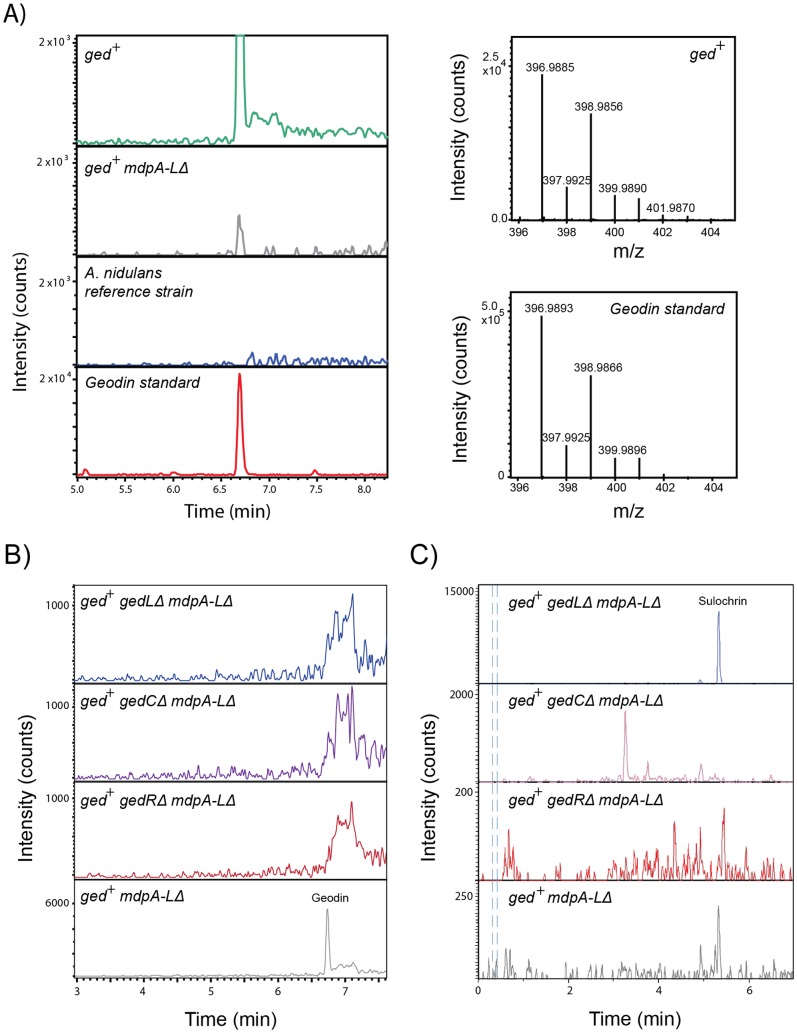
Figure 3. Production of geodin in A. nidulans ged+ strains.
A) Left panels depict extracted ion chromatograms (ESI-) of geodin m/z 396.9876 ± 0.005 amu from fungal extracts of ged+, ged+ mdpA-LΔ and reference strains (Bruker maXis system). An authentic geodin standard is included for comparison. The mass spectra of the putative geodin peak in ged+ and the authentic geodin standard are depicted in panels to the right. B) and C) ESI− chromatograms of geodin m/z 396.9876 ± 0.005 amu (B)) and sulochrin m/z 331.0812± 0.005 amu (C)) extracted from ged+ mdpA-LΔ (grey), ged+ mdpA-LΔ gedLΔ, (blue), ged+ mdpA-LΔ gedCΔ (purple) and ged+ mdpA-LΔ gedRΔ (red).

