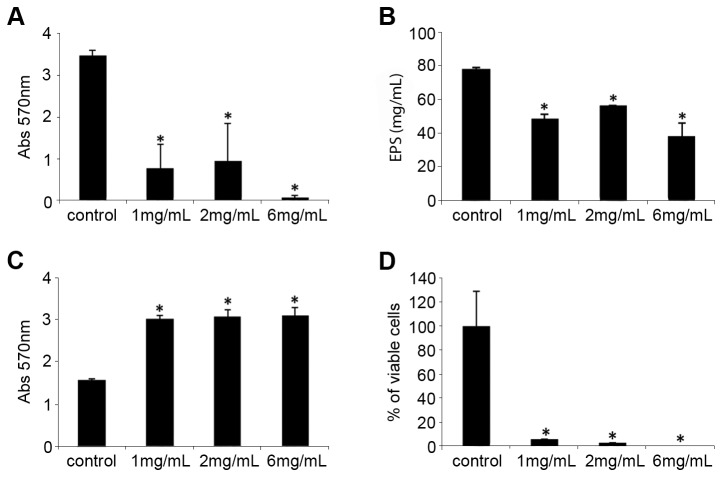
Figure 1. Effect of NAC on X. fastidiosa cells.
NAC concentrations of 1.0, 2.0, and 6.0 mg/mL were used for treating the cells. The treated plants were compared with the untreated control plants. The treatments were compared in relation to biofilm formation (A), amount of EPS (B), total biomass of planktonic fraction (C), and cellular viability (D). * indicates significant difference compared with the control (P < 0.05). The values correspond to the mean of three biological replicates. Error bars indicate the standard errors of the means.

