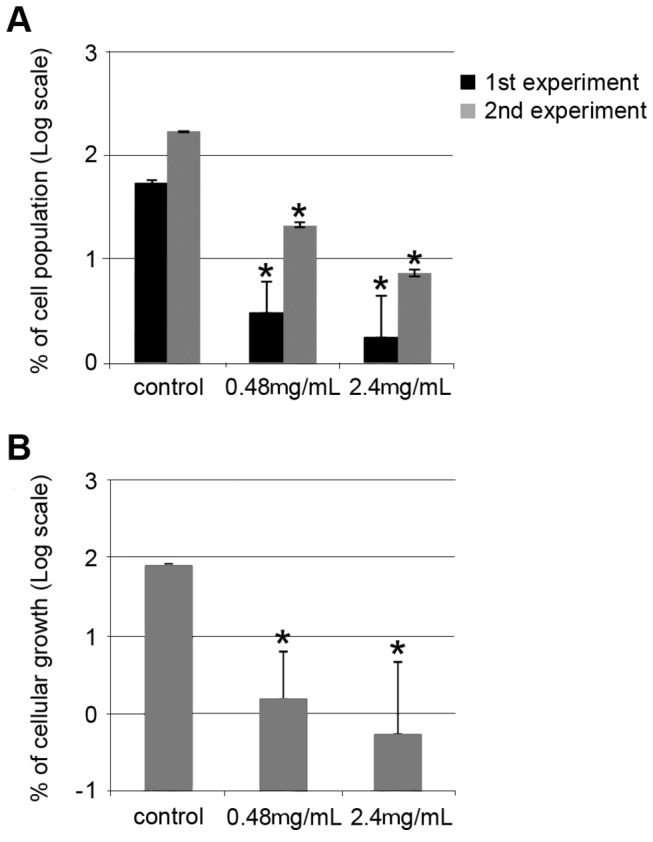
Figure 3. Effect of NAC on X. fastidiosa population in plants in hydroponics systems.

Plants were treated with different concentrations of NAC, and the populations were monitored by real-time PCR analysis (A) and isolation in culture medium (B). The results are represented in log scale and refer to the percentage of the final population in relation to the beginning population, where 2 equals 100% of the population before the treatments for each plant. The vertical bars represent the standard error of the mean. * indicates a significant difference compared with the control plants (P < 0.05). The values correspond to the mean of 4 plants.
