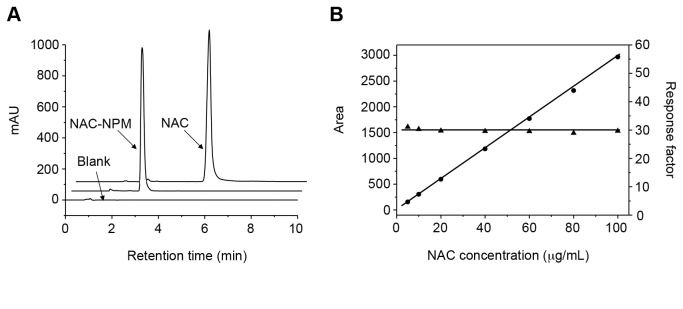
Figure 4. HPLC analysis of NAC.

The method specificity among the blank, NAC and NAC-NPM (A) and linearity of the quantitative method for NAC-NPM were evaluated by HPLC (B); The calibration curve (●) and response factor (▲) were obtained using NAC-NPM standard solutions (n = 21). The linearity was assessed through calculating the regression equation (y = ax ± b) and the correlation coefficient (r 2) by the least squares method, where: y = 29.33x + 7.219 and r 2 = 0.9997. Analytical parameters were as follows: column Phenomenex® Luna C18 (250 x 4,6 mm i.d., 5 μm particle size), Phenomenex® C18 pre-column (4 x 3 mm i.d., 5 μm particle size), mobile phase in a isocratic mode using acetonitrile and formic acid 0.1% (40: 60 v/v), oven temperature at 35°C with a flow rate of 1.2 mL/min, an injection volume of 20 µL and UV detection at 330 nm.
