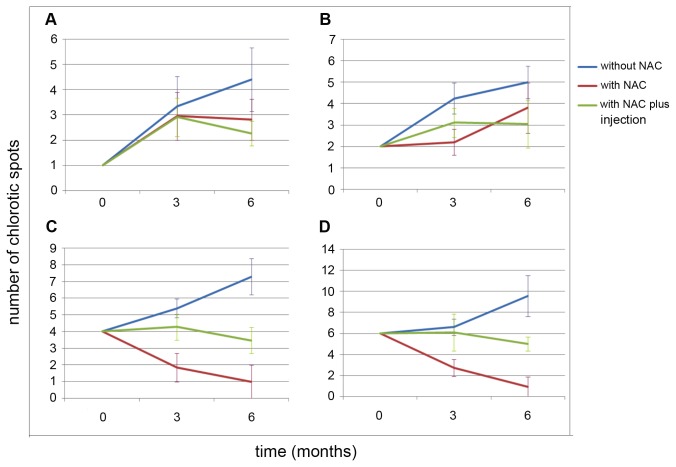
Figure 5. Symptom development in the fertigation experiment.
In this experiment, leaves with initial CVC symptoms from untreated plants or treated with NAC by fertigation or fertigation plus injection were compared over time. A, B, C, and D represent the average number of leaves that started the experiment with 1, 2, 4, and 6 chlorotic spots, respectively. The results presented are the averages of at least 10 leaves per plant per treatment. The bars represent the standard deviation of the mean.

