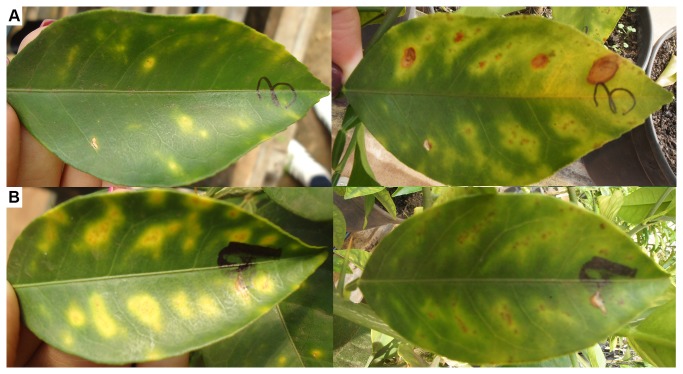
Figure 6. Visual analysis of CVC symptom development.
The picture shows representative leaves before and 6 months after starting the NAC treatment. Panel A shows the evolution of the symptoms in an untreated leaf. Panel B shows a leaf with severe symptoms at the beginning and more attenuated symptoms after the treatment.

