
Figure 7. Effect of NAC on X. fastidiosa population in fertigation-treated plants.
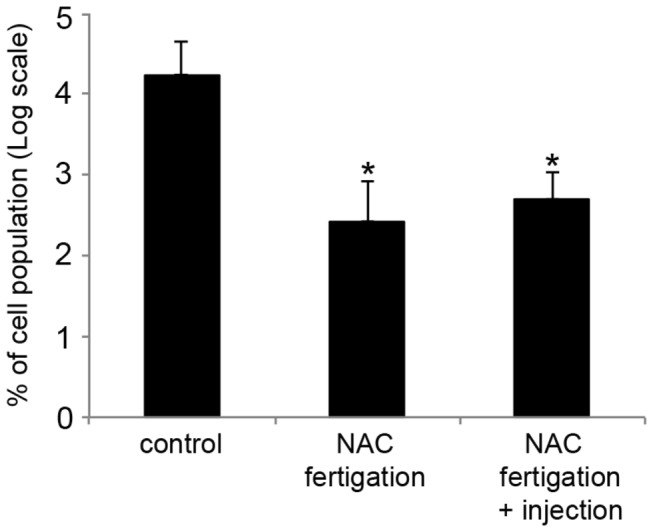
Real-time PCR was used to quantify the bacterial cells in plants treated or not with NAC. The results are represented using a log scale and refer to the percentage of the final population in relation to the beginning population, where 2 equal 100% of the population before the treatments for each plant. The vertical bars represent the standard error of the mean. * indicates a significant difference compared with the control plants (P < 0.05). The values correspond to the mean of 5 plants.