Figure 3.

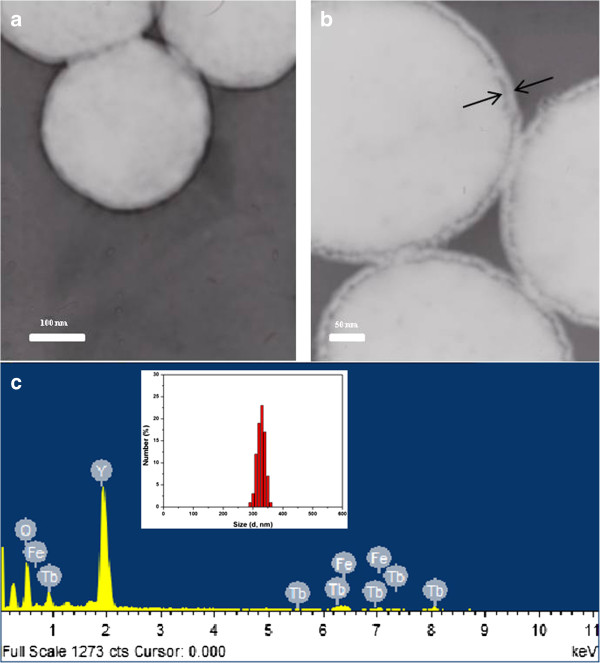
FETEM and EDX images of Fe3O4@Y2O3:Tb3+particles. (a) Low and (b) high magnifications of FETEM images and (c) EDX analysis and Fe3O4@Y2O3:Tb3+ size distribution (inset).

FETEM and EDX images of Fe3O4@Y2O3:Tb3+particles. (a) Low and (b) high magnifications of FETEM images and (c) EDX analysis and Fe3O4@Y2O3:Tb3+ size distribution (inset).