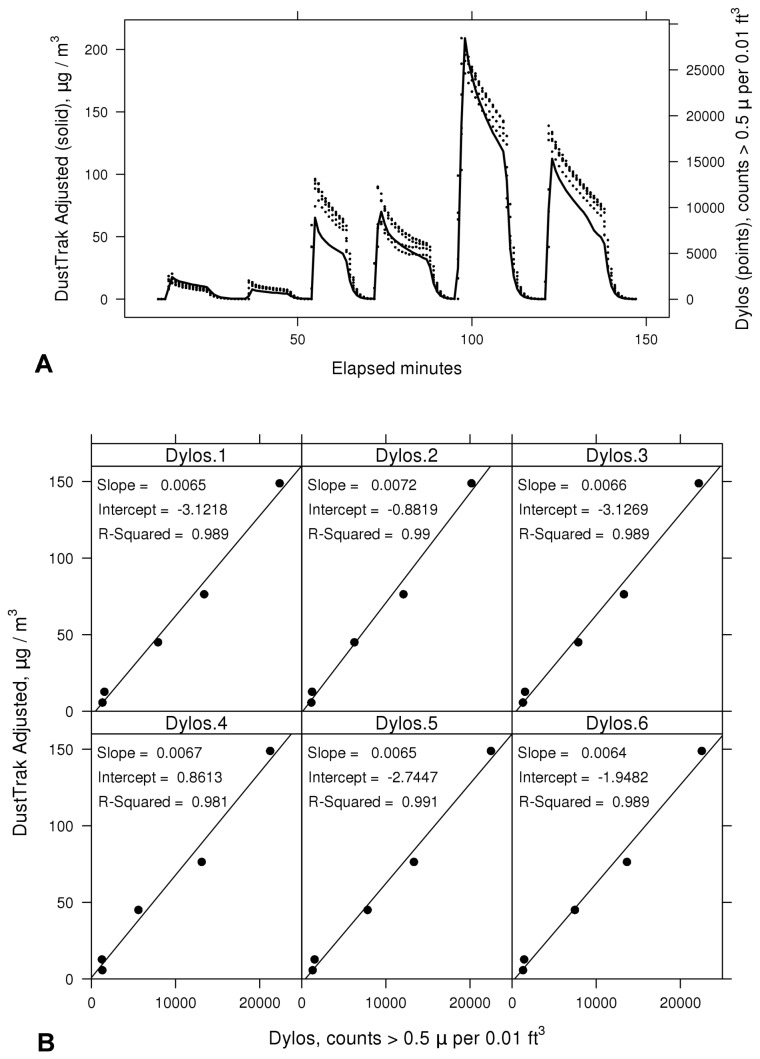
Figure 2. Response of Dylos particle counter versus mass-adjusted DustTrak monitor.
A. Time series plots of 1-minute readings from six Dylos units used in the present study (points) versus a mass-adjusted DustTrak for a series of 6 cigarette experiments (smooth line). B. Linear regressions showing relationship between average Dylos particle counts above 0.5 microns and DustTrak mass concentrations in μg/m3 for the six units. Counts above 2.5 microns were negligible.

