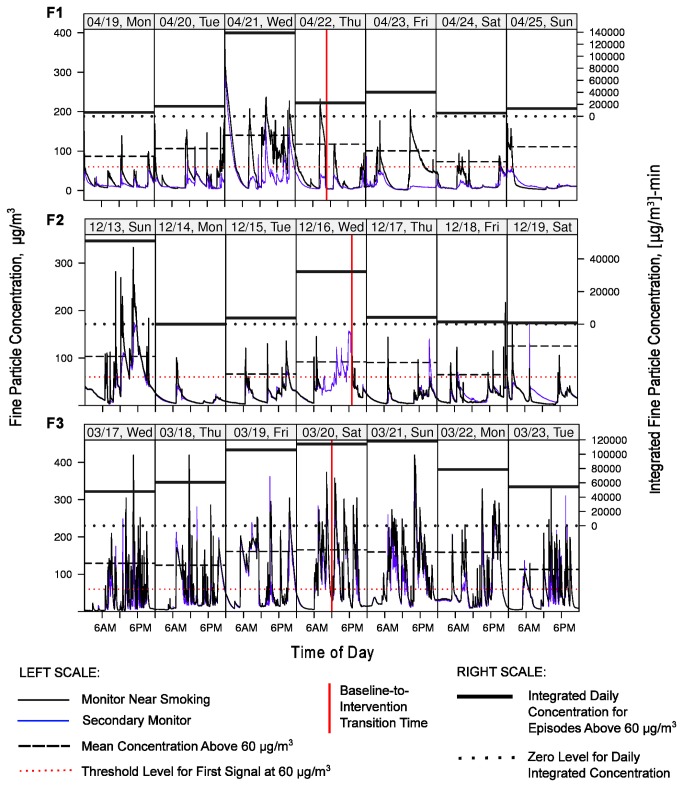
Figure 4. Week-long time series of 1-minute particle readings in the homes of the three intervention participants (F1, F2, F3).
Data are shown for 7 days of monitoring near the primary smoking area (black line; Kitchen-Dining-Living area for families F2 and F3; Bedroom for F1) and a secondary area (thinner blue line; Bedroom for F2 and F3; Kitchen-Dining-Living for F1), starting with 3 days during the baseline period (before the signals were activated) and ending after 3 days of the intervention (after signals were activated). The middle day on each plot is the “transition day” on which the signals were activated and the intervention was initiated. The precise transition time is indicated by a vertical red solid line. Family F2 had missing data (due to monitor losing power) in the Kitchen-Dining-Living area for a large portion of the transition day, although both rooms track well for most periods, so the missing data can be inferred from the Bedroom results. The horizontal red dotted line designates the 60 µg/m3 first feedback-signal threshold (left scale). Black horizontal dashed lines designate the mean daily concentration of levels exceeding 60 µg/m3 in Bedroom for F1 and F2 and Kitchen-Dining-Living for F3 (left scale). Thick horizontal lines show the daily integrated (area-under-the-curve) values on the right scale in units of [µg/m3]-min for episodes when these same room levels exceeded 60 µg/m3.

