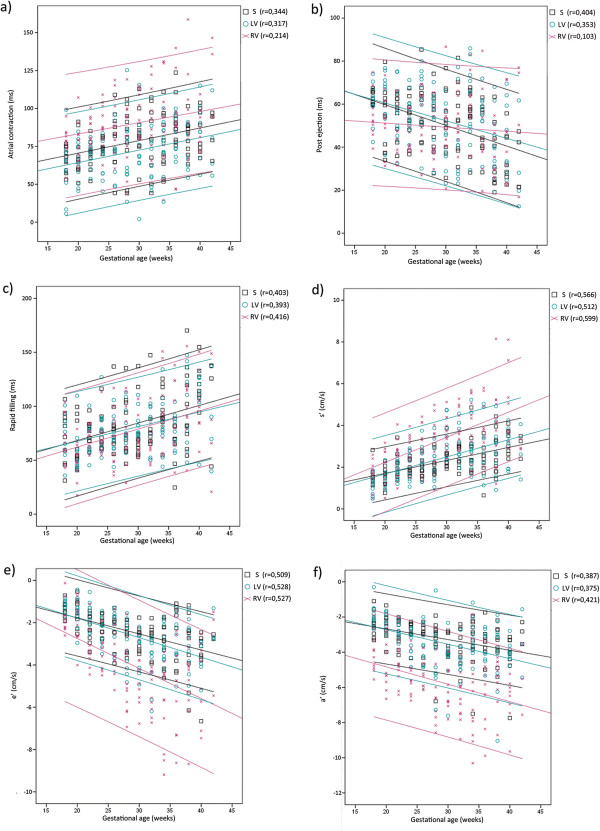
Figure 4.

Tissue velocity imaging reference values. The duration of (a) atrial contraction, (b) post ejection and (c) rapid filling, as well as the peak velocities of (d) ventricular ejection (s’), (e) rapid filling (e’) and (f) atrial contraction (a’), extracted from septum as well as the left and right ventricular free wall plotted over gestational age (p < 0,001). The figure displays linear regression analysis with 95% confidence interval. S, septum; LV, left ventricular free wall; RV, Right ventricular free wall.
