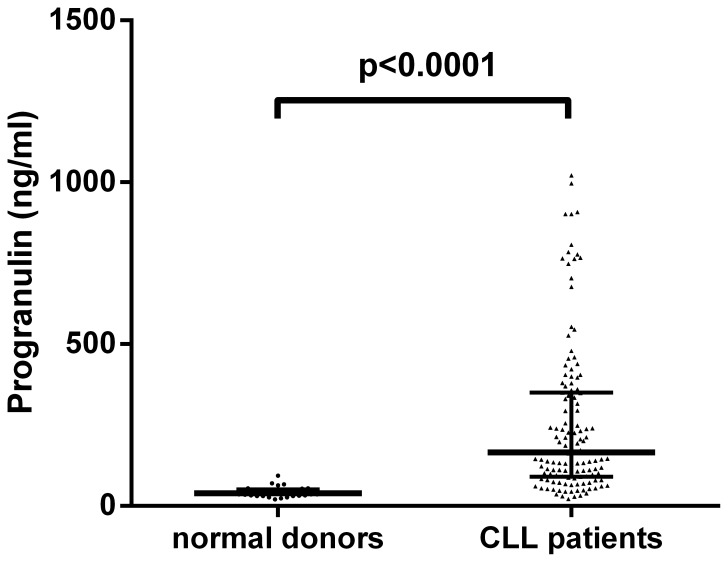
Figure 1. Progranulin plasma levels in CLL patients and normal blood donors.
ELISA analysis of plasma samples collected from CLL patients (N = 131) and normal blood donors (ND, N = 31) reveals statistically significant differences in Pgrn concentrations (Mann-Whitney U-Test). The bold horizontal bars represent the median and the whiskers indicate the interquartile range.

