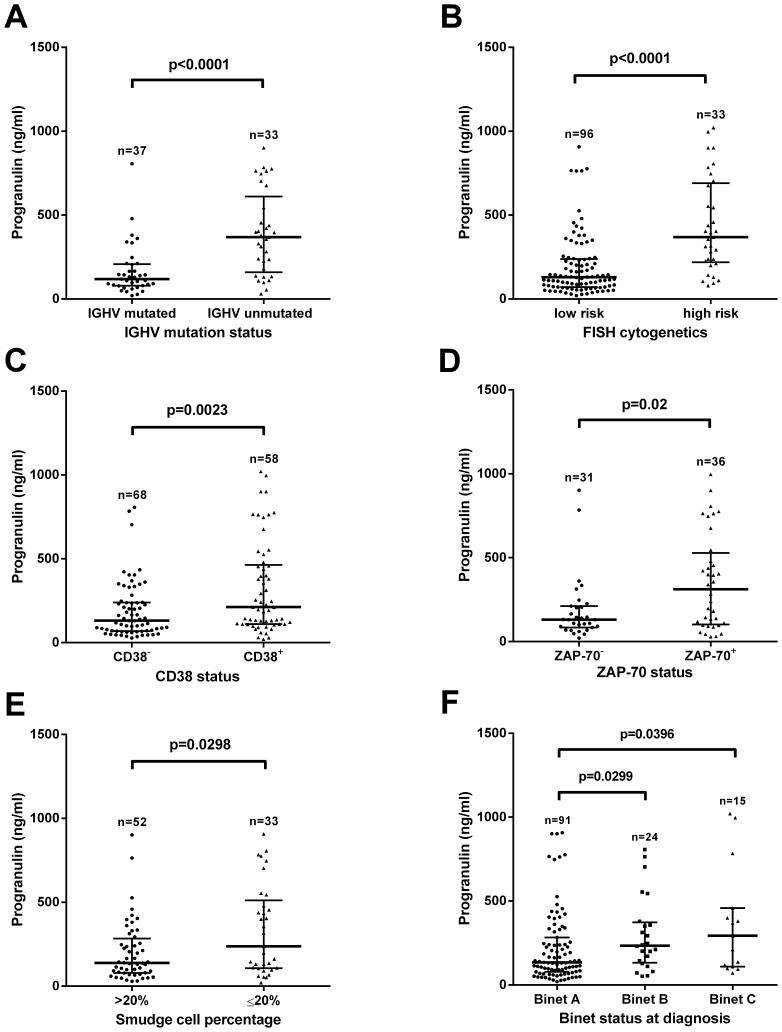
Figure 2. Correlation of Progranulin plasma levels and established prognostic markers in the CLL cohort from Essen.
Plasma samples collected from high-risk patients defined by the presence of unmutated IGHV genes (A), presence of del17p and/or del11q as detected by iFISH (B), expression of CD38 (C) and ZAP-70 (D), low percentage of smudge cells (E) as well as advanced Binet stage B/C (F) exhibited significantly higher Pgrn plasma concentrations as compared to low-risk patients. Statistical comparisons were made using the Mann-Whitney U-test (A–E) and Kruskall Wallis test (F). The bold horizontal bars represent the median and the whiskers indicate the interquartile range.

