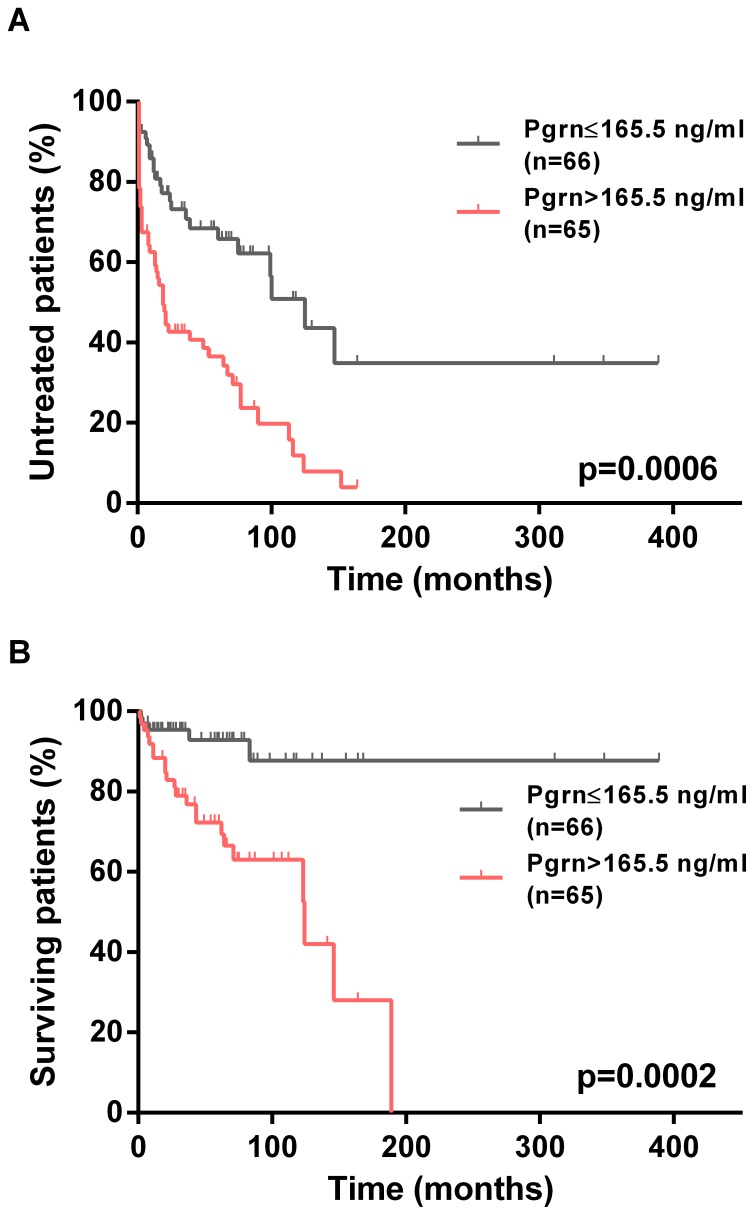
Figure 3. Association of Pgrn plasma levels and clinical outcome in the CLL cohort from Essen.
Kaplan-Meier curves depict the cumulative proportion of untreated (TTFT, A) and surviving (OS, B) patients with CLL. Statistical comparisons between patients with high (>165.5 ng/ml) and low Pgrn plasma levels (≤165.5 ng/ml) were performed using the log-rank test.

