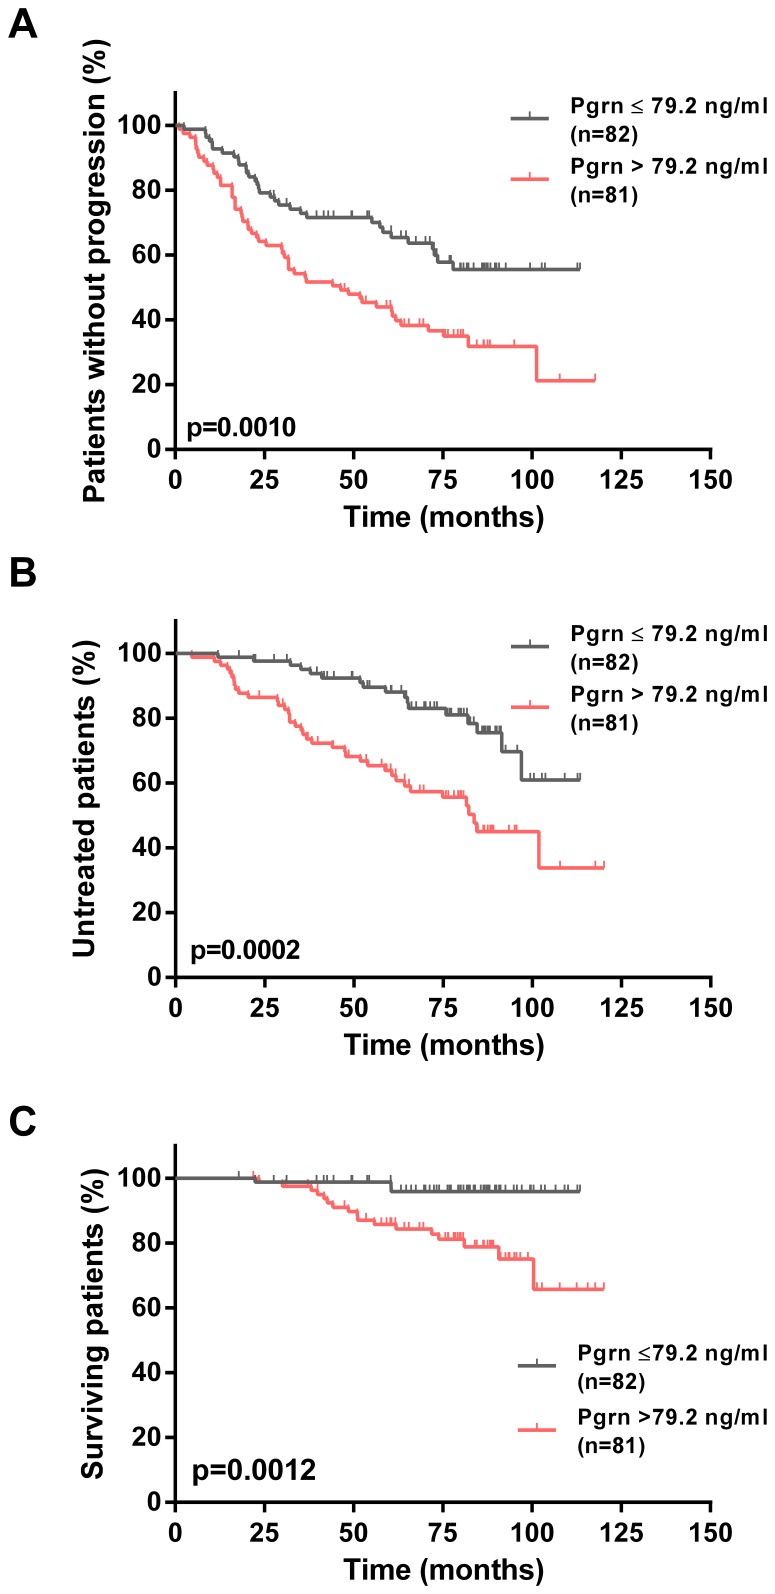
Figure 5. Association of Pgrn plasma levels and clinical outcome in the multicentric CLL1 cohort.
Kaplan-Meier curves depict the cumulative proportion of progression free survival (PFS, A), time to first treatment (TTFT, B) and overall survival (OS, C) of patients with CLL. Statistical comparisons between patients with high (>79.2 ng/ml) and low Pgrn plasma levels (≤79.2 ng/ml) were performed using the log-rank test.

