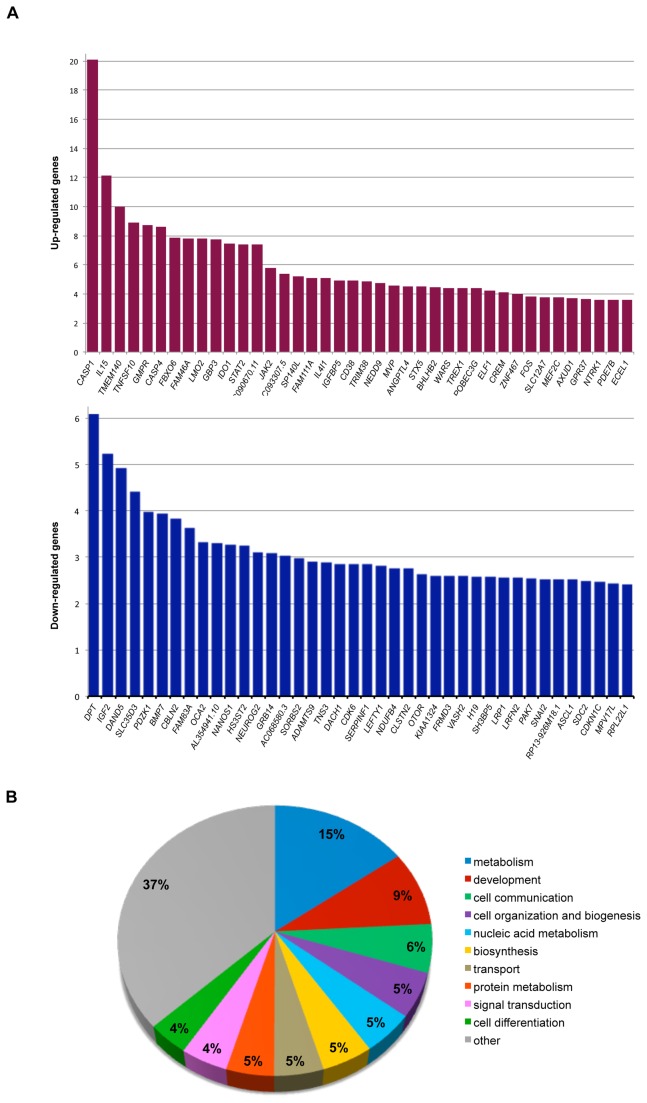
Figure 2. Overview of differentially expressed genes after TCF4 knockdown.
(A) Top 40 upregulated (upper panel) and downregulated (lower panel) genes after FDR correction (0.01) ranked by fold change. (B) Functional characterization of all differentially expressed genes (upregulated and downregulated) (FDR 0.01) using GOSLIM annotations. All annotation categories representing less than 4% of the gene list were grouped and labeled as “other”.

