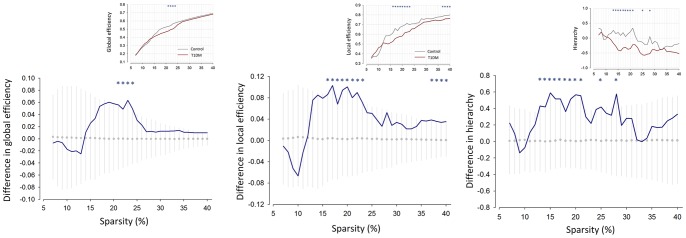
Figure 1. Between-group differences in global efficiency, local efficiency, and hierarchical organization of whole-brain structural networks.

The graphs showed the differences in network parameters between the T1DM and control groups (blue line). The mean values and 95% of confidence interval of the null distribution of between-group differences obtained from 1000 permutation tests at each sparsity level were represented as gray circles and error bars, respectively. Asterisks indicate significant differences in parameters between the T1DM and control groups at P<0.05. Inset graphs show the global efficiency (Eglob), local efficiency (Eloc), and hierarchical organization (β) of whole-brain structural networks in T1DM (red line) and control (gray line) subjects as functions of sparsity thresholds. Abbreviations: T1DM, type 1 diabetes mellitus.
