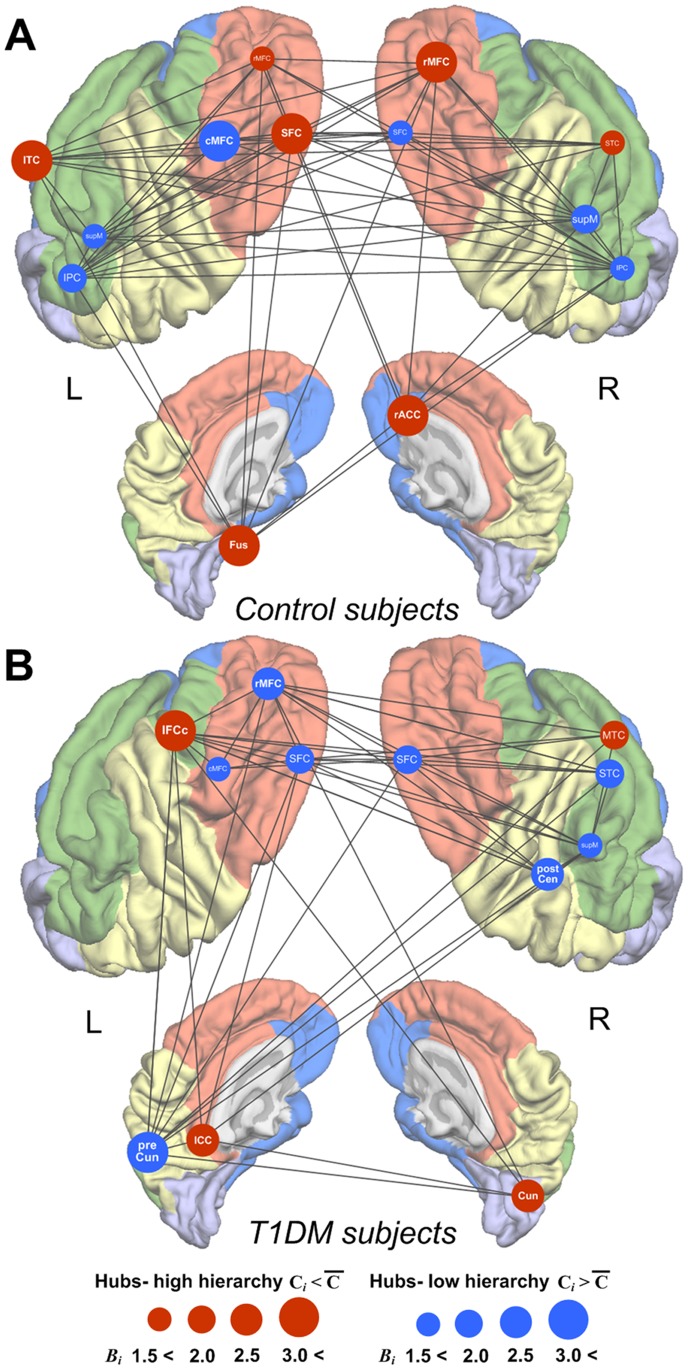
Figure 3. Location of hubs and inter-hub structural connections in whole-brain structural networks.
Regions (brain templates of panels A for control and B T1DM subjects) in orange, green, blue, yellow, and light purple colors represent each intrinsic cortical structural sub-network system subserving strategic/executive control, language, mnemonic/emotional processing, sensorimotor, and visual functions, respectively. Figures depict hub regions and significant inter-hub structural connections of control (A) and T1DM (B) subjects at the sparsity threshold of 0.23. A given region was identified as a hub of whole-brain structural networks if its normalized betweenness-centrality (Bi) was greater than 1.5 and its degree (Ki) was above the network mean at the sparsity threshold of 0.23. Red circles denote the hub regions with low clustering (less than average clustering of whole-brain structural networks) indicating hubs at a higher position in the hierarchical organization. Blue circles denote the hub regions with high clustering (greater than average clustering of whole-brain structural networks) indicating hubs at a lower position in the hierarchical organization. The radius of circles is in proportion of the value of Bi of the region at sparsity threshold of 0.23. Abbreviations: T1DM, type 1 diabetes mellitus; R, right; L, left; SFC, superior frontal cortex; rMFC, rostral middle frontal cortex; cMFC, caudal middle frontal cortex; ICC, isthmus cingulate cortex; IFCc, inferior frontal cortex- pars opercularis; IPC, inferior parietal cortex; supM, supramarginal cortex; STC, superior temporal cortex; MTC, middle temporal cortex; rACC, rostral anterior cingulate cortex; ITC, inferior temporal cortex; Fus, fusiform cortex; postCen, postcentral cortex; preCun, precuneus cortex; Cun, cuneus cortex.

