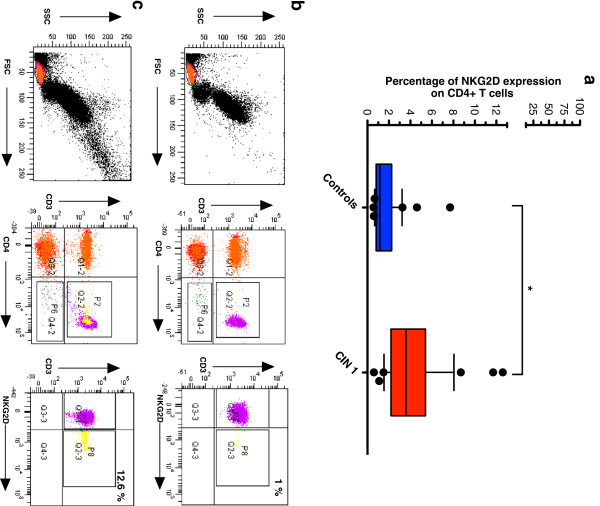
Figure 2.
NKG2D-expressing CD4+ T cells significantly increase in patients with CIN 1. Three-color flow cytometric analysis to detect the expression of NKG2D on peripheral CD4 T cells was carried out in CIN 1 patients and control donors. Cells from the lymphocyte gate were subgated based on CD3 expression and CD4 co-expression. Then, changes in NKG2D expression on CD4+ T cell populations were evaluated. The given percentages reflect the portion of cells positive for NKG2D within the given sub-population. There was a significant increase in CD4+NKG2D+ T cells in the group of CIN 1 patients when compared with normal donors (a). Representative experiment is showed in (b), CD3+CD4+ cells were divided into two populations: NKG2D- and NKG2D+ (gate P7 and P8, respectively). It can be clearly seen a control donor practically negative for CD4+NKG2D+ T cells. The other example in (c) shows a CIN 1 patient with a high percentage of CD4+NKG2D+ T cells. Statistical analysis was performed through Mann–Whitney U test and data are expressed as median, which are represented as horizontal lines and 10th and 90th percentiles as whiskers. Extreme values are also showed (•); *p < 0.001.

