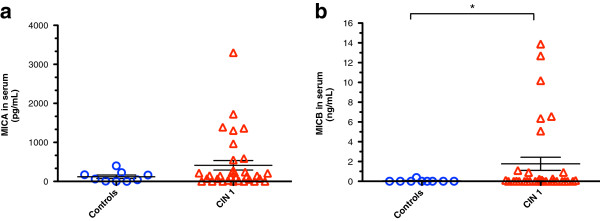
Figure 3.

The highest levels of soluble MICA and MICB are seen in CIN 1 patients. Levels of soluble MICA and MICB were detected using commercial ELISA kits. The highest levels for both MICA (a) and MICB (b) were found in CIN 1 patients when compared to healthy controls. While the group of CIN 1 patients showed only a non-significant trend to high soluble MICA, the levels of soluble MICB were significantly augmented in this group versus controls. Statistical analysis was performed through one-tailed Mann–Whitney U test and data are expressed as mean ± SEM (horizontal lines). Absorbance values are shown as pg/mL (MICA) and ng/mL (MICB); *p = 0.03.
