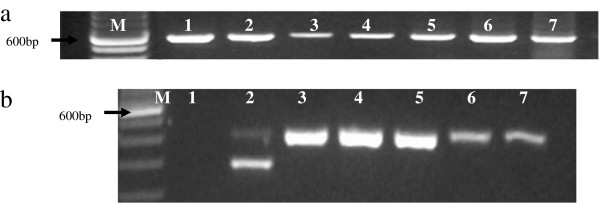
Figure 2.

PCR analysis of Wolbachia organ distribution and comparative inter-country density. (a) Distribution of Wolbachia in G. austeni organs using wsp. The results of two representative flies are shown: M-100 bp DNA marker, lane 1-♂head, lane 2-♂thorax, lane 3-♂abdomen, lane 4-♀reproductive tract, lane 5-♀head, lane 6-♀thorax, lane 7-♀legs. Arrow indicates 600 bp. (b) 16S rRNA analysis of G. austeni from Kenya and South Africa: M-100 bpDNA marker, Lane 1-NC, Lane 2-G. morsitans, Lanes 3, 4, 5-G. austeni Kenya, Lanes 6, 7-G. austeni South Africa. Arrow indicates 600 bp. Results of five representative samples are shown here out of 50 samples analyzed.
