FIG. 2.
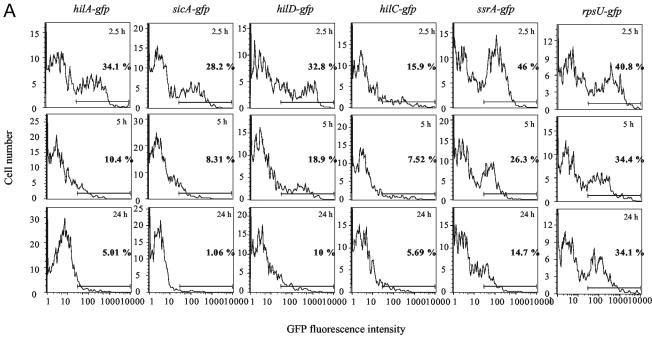
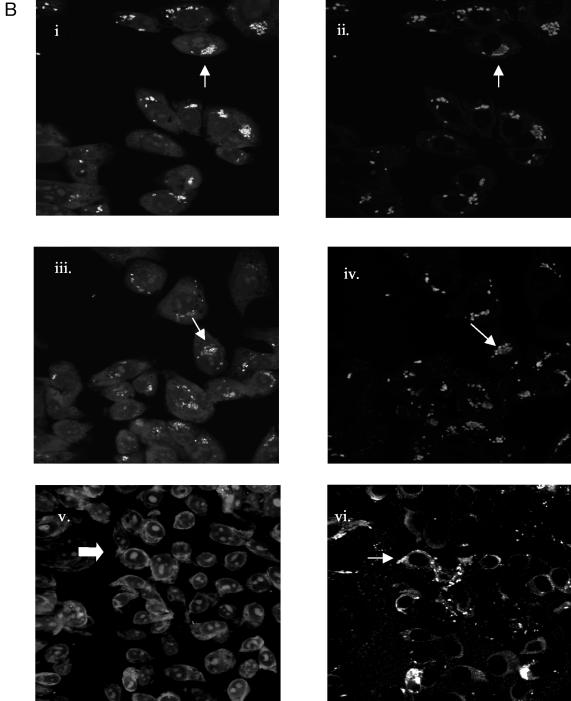
Expression of SPI-1 invasion genes decreases after infection of HEp-2 epithelial cells. (A) FACS analysis was performed after lysing of infected epithelial cells and stainingof intracellular Salmonella (see Materials and Methods) 2.5, 5, and 24 h after inoculation of bacteria onto HEp-2 cell monolayers. The percentage of GFP-positive bacteria and the length of infection are indicated on each histogram. The horizontal lines represent the gate used to determine the percentage of GFP-positive bacteria in each sample. (B) Confocal microscopy was performed on cell monolayers infected with Salmonella containing pPhilA-gfp[ASV] 2.5, 5, and 24 h after infection. After infection, samples were fixed, permeabilized, and stained with ethidium bromide, anti-Salmonella antiserum, and a secondary antibody conjugated to Cy 5. The top two micrographs show the same microscopic field 2.5 h after infection. Likewise, the middle and bottom micrographs show the same fields 5 and 24 h after infection, respectively. The micrographs on the left show the GFP fluorescence of bacteria within epithelial cells stained with ethidium bromide. The micrographs on the right show bacteria within the same fields as on the left stained with Salmonella-specific antibody and Cy 5 as a positive control for the presence of bacteria. The arrowheads point to bacteria that are expressing GFP and that are stained with Cy 5 in adjacent micrographs of the same field. The arrow in the lower left micrograph points to bacteria that are not expressing GFP (as no green fluorescence was detected); however, the diffuse (red) fluorescence that is visible is likely due to staining of the bacterial nucleic acids by ethidium bromide; the arrowhead in the lower right micrograph points to bacteria in the same area of the microscopic field that are stained with Cy 5.


