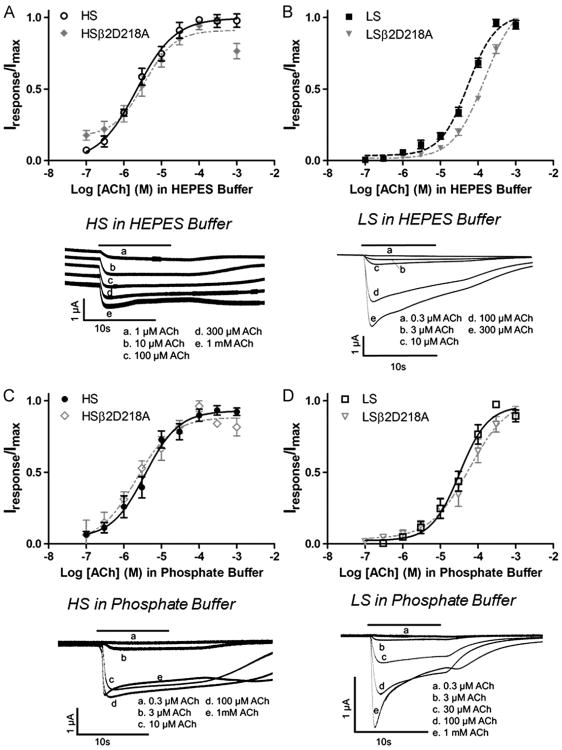
Fig. 1.
Acetylcholine concentration/response curves obtained in HEPES and phosphate ND-96 recording buffer. Xenopus oocytes expressing high-sensitivity α4β2 nicotinic acetylcholine receptors (HS) (mRNA injected at a ratio of 1α:5β) or low-sensitivity receptors (LS) (mRNA injected at a ratio of 5α:1β) were exposed to increasing concentrations of acetylcholine (ACh) in HEPES (A) and (B) or phosphate (C) and (D) recording buffer. Individual peak amplitudes were normalized to the Imax on the same oocyte. Response traces were recorded from a single oocyte in either the HS or LS preparation. The solid bar above the response trace indicates the time the oocyte was exposed to acetylcholine. In Fig. 1A, individual response traces were offset for clarity although all five traces had identical baseline currents. pEC50 and nH values (see Table 1) were determined using non-linear curve fitting as described in the methods. Data points represent at least four replicate values obtained from four different oocytes harvested from at least two different frogs. Error bars indicate ± S.E.M.

