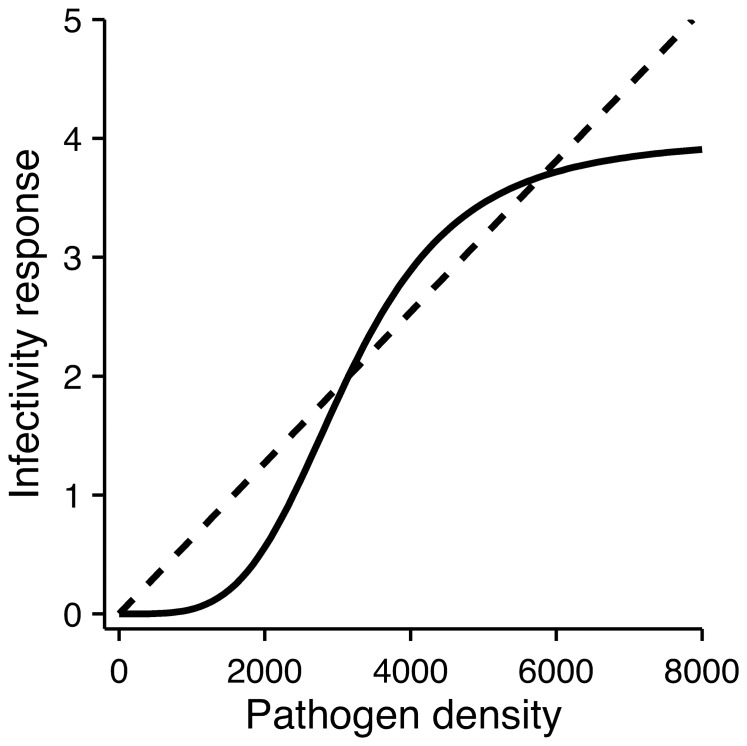
Figure 1. The infectivity response of the pathogen f(P) is assumed to be either linear (dashed line) or sigmoidal (solid line) function of pathogen density (P).
To facilitate comparison, linear infectivity is modeled with rate constant β/2ID 50 and the parameters for sigmoidal response (eq. 2) are set to ID 50 = 3150 and κ = 4. The curves intersect at ID 50.

