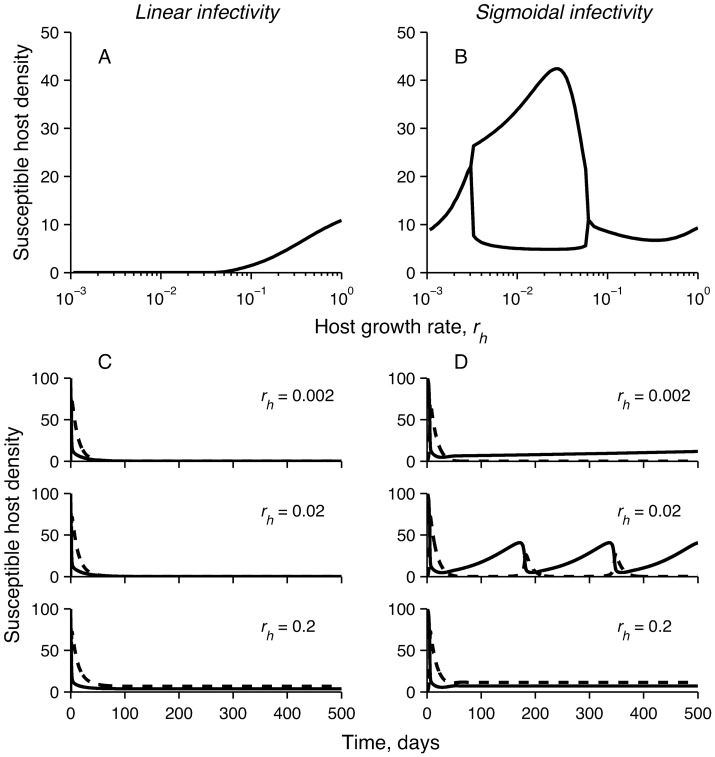
Figure 2. Susceptible host response to increasing host growth rate depending on the form of pathogen infective response (either linear or sigmoidal).
Here the competitive disadvantage (α) is fixed to 0.05 and the number of competitor species (n) to 6. Linear infectivity response with rate constant β/2ID 50 was used in panels (a) and (c), and ID 50 = 3150, κ = 4 for sigmoidal response (eqn. 2) in panels (b) and (d).The lines in (a) and (b) represent minima and maxima of population densities. In (c) and (d) the solid line is susceptible host density and the dotted line is infected host density.

