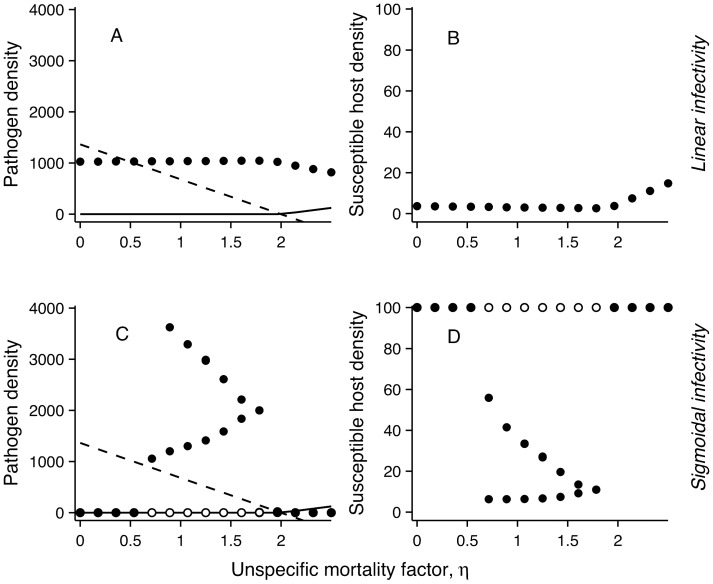
Figure 4. Density-independent mortality η affects pathogen and susceptible host densities.
Here the number of competitors is fixed to 15 and pathogen competitive disadvantage α is fixed to 0.05. Linear infectivity response with rate constant β/2ID 50 was used in panels (a) and (b), and sigmoidal response (eqn. 2) in panels (c) and (d). Filled symbols represent minimum and maximum densities. In the cyclic range in (c) and (d) open symbols show the alternative attractor and filled symbols show minima and maxima. The solid and dashed lines indicate the equilibrium pathogen and non-pathogenic competitor densities without hosts, respectively.

