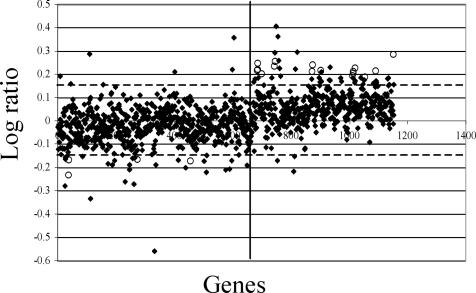
FIG. 2.
Spot graph log ratio plot analysis of Borrelia gene expression from array raw data of untreated versus CB2-treated (20 μg/ml) condition at 25 min. Dashed horizontal lines represent 2 SD above or below the mean of the log ratio plot. Solid vertical lines separate chromosomal (left) from plasmid (right) genes. Highlighted spots (○) represent genes that are significant by both criteria (see also Table 2).

