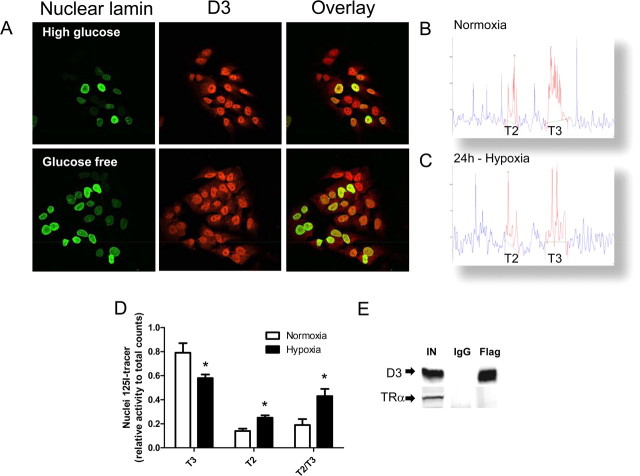
Figure 4.
T3/T2 levels in the nucleus during hypoxia and effect of glucose deprivation on D3 under hypoxia. A, SK-N-AS cells were incubated with high glucose (4.5 g/L) versus glucose-free medium for 24 h under hypoxia; nuclear localization of D3 was examined by immunofluorescence using α-D3(CT) antibody. B, C, Nuclear T3 and T2 profiles of normoxic (B) or hypoxic (C) SK-N-AS cells. D, Relative concentrations of T3 and T2 in the nucleus of SK-N-AS under normoxia and hypoxia. E, Immunoprecipitation of D3 was done in HEK-293 cells transiently expressing flag-tagged D3-Cys and TRα. IN, 20% of total input; IgG, immunoprecipitated by IgG; Flag, immunoprecipitated by α-FLAG. The presence of TRα was examined by Western blot with α-TRα antibody.

