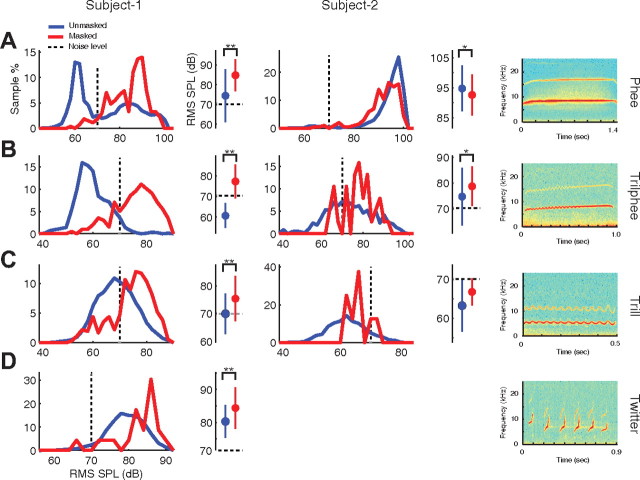
Figure 1.
Distributions of vocalization intensity and the Lombard effect in marmosets. Distributions of vocalization intensity are shown for normal or unmasked (blue) and masked (red) conditions for four major marmoset vocalization types: phee (row A), trilphee (row B), trill (row C), and twitter (row D) measured from two individual animals (left column: Subject 1, marmoset-M49p; middle column: Subject 2, marmoset-M49r). Subject 2 did not produce sufficient twitter calls. The number of calls produced during masking were 271, 198, 366, and 23 (phees, trilphees, trills, and twitters) for Subject 1. and 127, 38, and 8 for Subject 2. The relatively low number of trilphees and trills accounts for irregularity noted in the plots for Subject 2. The right column shows examples of spectrograms of four marmoset vocalization types. A plot on the right of each intensity distribution compares the mean vocal intensities between the unmasked and masked conditions. Error bar indicates SD. *p < 0.05; **p < 0.001, rank sum. The level of the continuous masking noise (70 dB) is indicated on each plot (gray dashed line).

