
Figure 3.
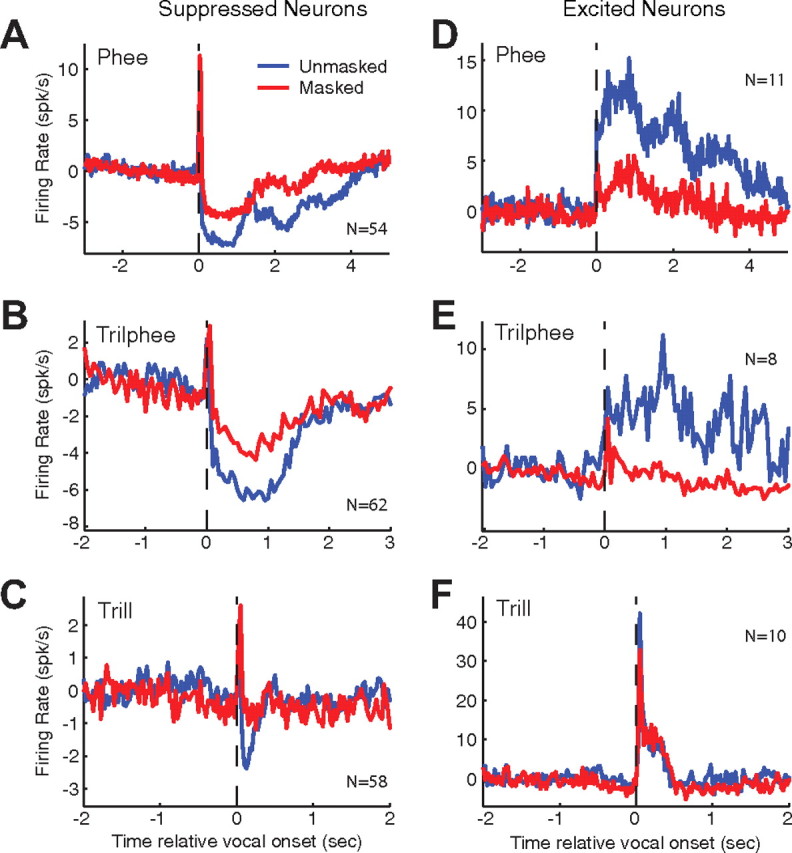
Average effects of masking on suppressed and excited neural populations. Average PSTHs were calculated from responses of multiple individual neurons to compare vocal responses during unmasked (blue) and masked (red) feedback conditions. Neural responses were aligned by their vocal onsets (dashed line) and averaged using 25 ms binwidths after subtraction of the prevocal firing rate. Responses to different classes of vocalizations are plotted separately: phee, trilphee, and trill. Suppressed (RMI ≤ −0.2, A–C) and excited (RMI ≥ 0.2, D–F) neural populations are shown individually. Vocalization-induced suppression was reduced for all classes of vocalization in masked conditions (A–C). Vocalization-related excitation was attenuated in masked conditions for both phees (D) and trilphees (E), but less so for trills (F).