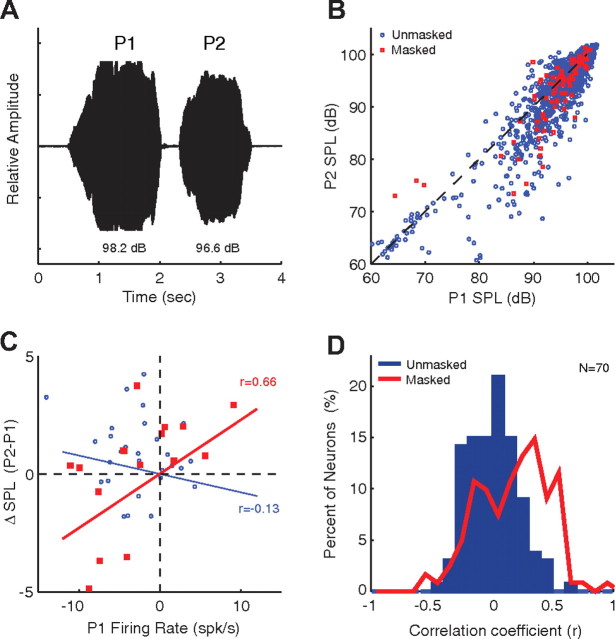
Figure 7.
Prediction of vocal compensation by neural responses. Responses of multiphrase phee vocalizations (A) were examined to see if neural activity during the first phrase (P1) predicted changes in vocal intensity between the first and second phrases (P2–P1). B, Scatter plot comparing P1 and P2 vocal amplitudes and showing a high degree of correlation for normal vocalizations (r = 0.91, p < 0.001; blue). Vocal amplitudes for masked vocalizations are also shown (red). The average unmasked change in SPL between phrases was small (−1.5 ± 3.3 dB SPL). C, The change in vocal amplitude form P1 to P2 is plotted against the firing rate during P1 for a number of vocalizations recorded from a sample neuron. Solid lines are linear regression estimates. There was a significant correlation during masking (red; r = 0.66, p < 0.001), but not during unmasked conditions (blue; r = −0.13, p > 0.05). D, Distribution of correlation coefficients between the vocal amplitude change (P2–P1) and P1 firing rate calculated for a population of auditory cortex neurons. The correlation coefficients were significantly higher during masking conditions (p < 0.001, rank sum).

