
Figure 3.
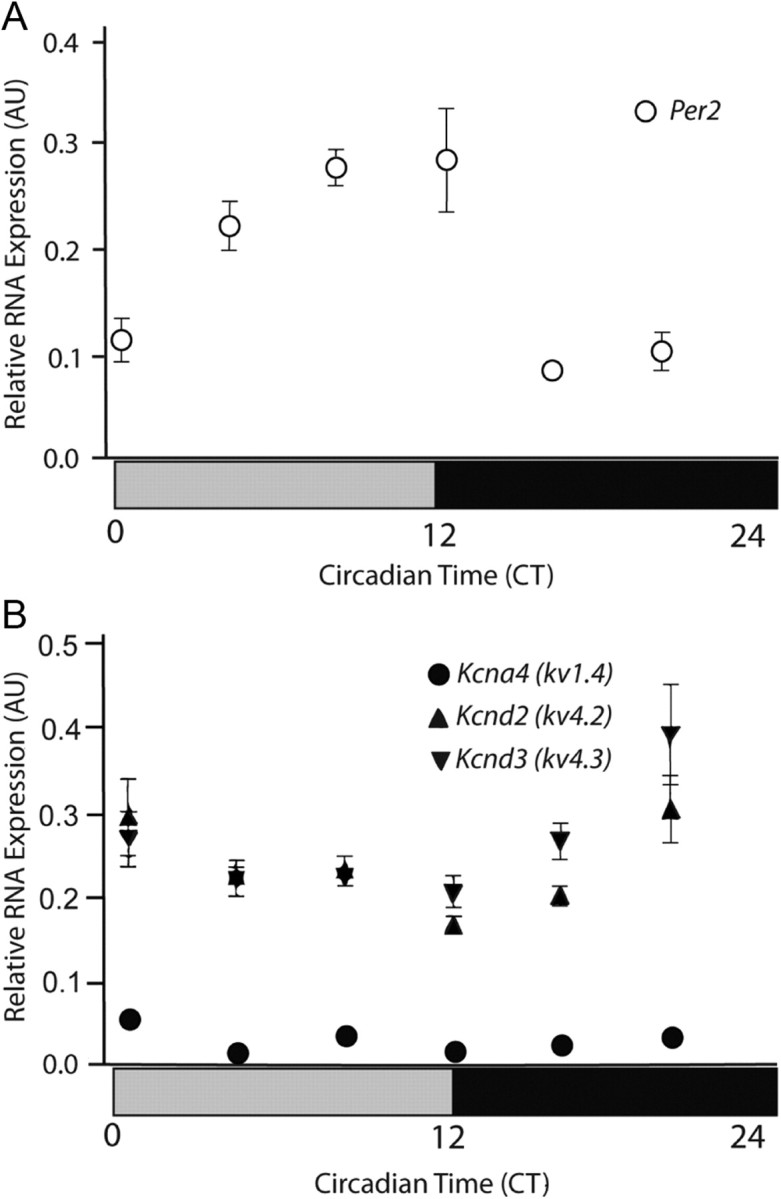
Kv channel α subunit expression levels in the SCN do not vary with CT. Transcript levels of Per2 (A) and of the IA channel pore-forming (α) subunits, Kcnd2, Kcnd3, and Kcna4 (B), were examined in the SCN as a function of CT. Transcript levels in each sample were determined by qRT-PCR and normalized to the Hprt transcript, as described previously (see Materials and Methods). Mice were maintained in constant darkness for two days before beginning these experiments. SCN tissue samples were collected (and frozen for subsequent RNA isolations) at the times indicated. Data are presented as means ± SEM (n = 4 mice per time point).