Figure 4.
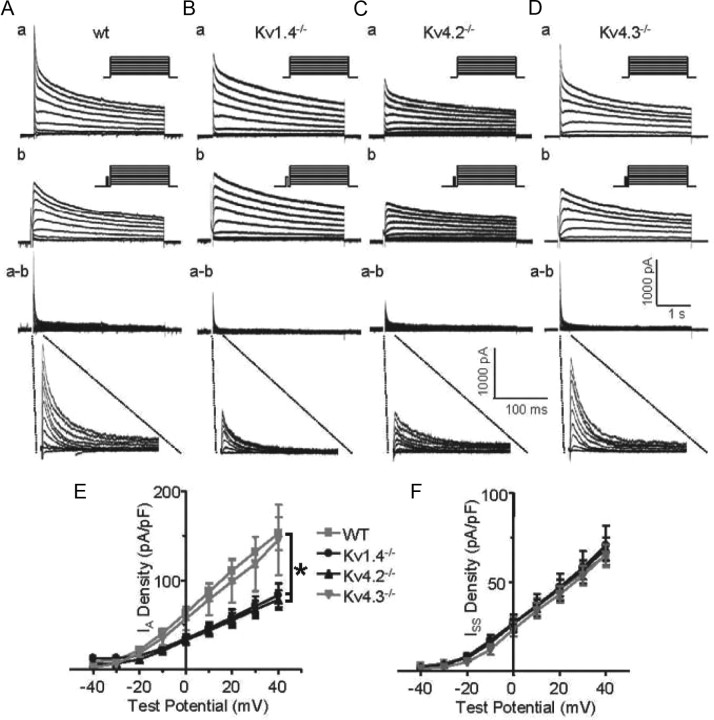
IA densities are reduced in Kv4.2−/− and Kv1.4−/− SCN neurons. Aa–Da, Representative whole-cell Kv currents, recorded in response to voltage steps to potentials ranging from −40 to +40 mV (in 10 mV increments) from a holding potential of −70 mV in WT (Aa), Kv4.2−/− (Ba), Kv4.3−/− (Ca), and Kv1.4−/− (Da) SCN neurons, are displayed. In each cell, outward Kv currents evoked at the same test potentials were also recorded following a brief prepulse to −20 mV to inactivate IA. The amplitudes of IA in individual cells of each genotype were then obtained by digital off-line subtraction (a-b) of the recordings with the prepulse (b) from the recordings without the prepulse (a); the subtracted records are also shown on an unexpanded time scale to facilitate direct comparisons. Mean (±SEM) IA (E) and steady-state Kv current (ISS) densities (F) in WT (n = 10), Kv4.2−/−(n = 20), Kv4.3−/− (n = 5), and Kv1.4−/− (n = 14) SCN neurons are plotted as function of test potential. *Values indicated are significantly different at the p < 0.001.

