
Figure 6.
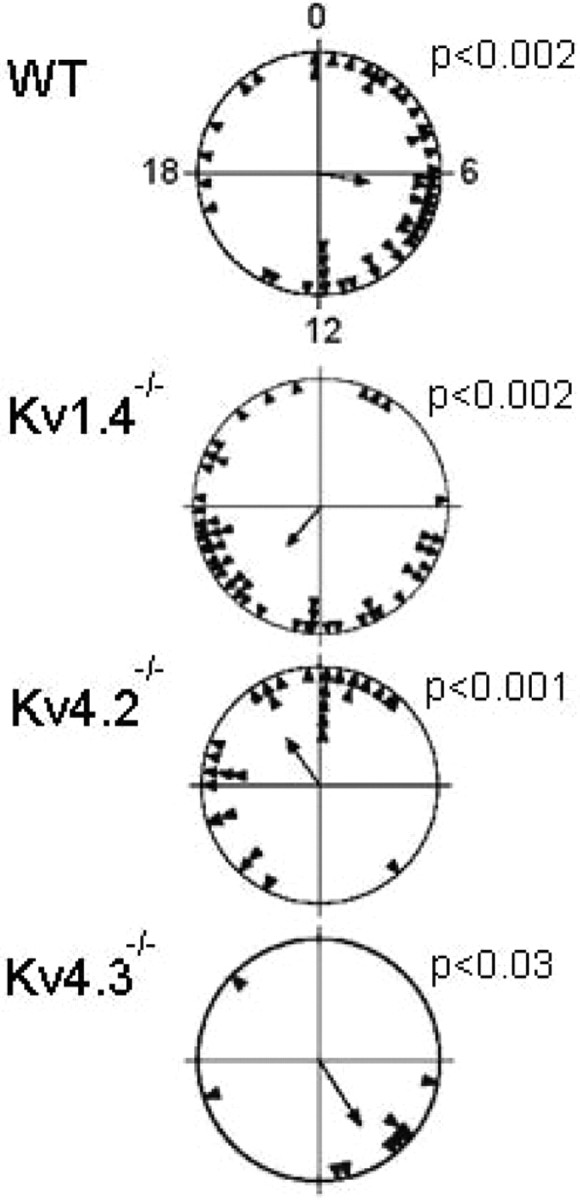
Circadian periods of individual SCN neurons are synchronized to each other independent of genotype. Rayleigh plots show the time of peak firing for each neuron (filled triangle) on a representative recording day. The Rayleigh statistic calculates the mean phase of the population of neurons (arrow) and the probability that the measured phases were uniformly distributed (p > 0.05). For these representative cultures from each of the four genotypes, the Rayleigh statistic indicates that the phases of the individual neurons were not random and were similarly distributed, suggesting that the loss of Kv1.4, Kv4.2, or Kv4.3 did not impact the synchronization of circadian firing patterns among SCN neurons.