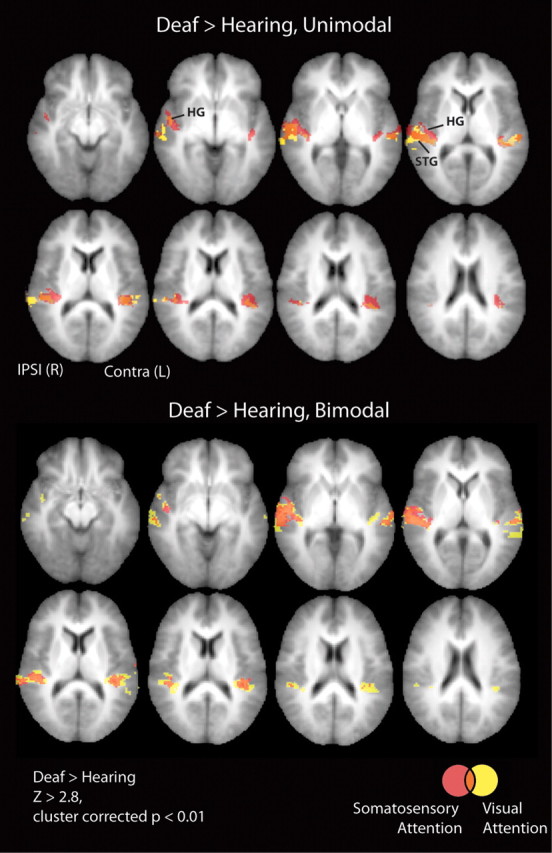
Figure 3.

Whole-brain analysis of group differences. Group level differences between deaf and hearing adults provided a whole-brain view of the results that we then analyzed in more detail with ROI analyses. Heschl's gyrus, planum temporale, and superior-temporal cortex are sites where deaf had larger signal than hearing for the contrasts of stimulation versus resting fixation (see Tables 2 and 3) and are shown overlaid on axial slices of the average structural MRI of the participants in the study for slices where signal in the deaf participants was greater than signal in hearing participants (Z > 2.8, cluster corrected p < 0.01). Slices inferior and superior to those shown had no significant clusters, and there were no clusters with significantly greater activation for hearing than deaf participants in any slice. Top, Unimodal somatosensory and visual stimulation. Bottom, Bimodal stimulation with somatosensory or visual attention. Red, Somatosensory; yellow, visual; orange, overlap of visual and somatosensory. Signal in the anterior aspect of atlas-defined Heschl's was significantly larger in deaf than hearing only for unimodal somatosensory stimulation while unimodal visual stimulation elicited greater signal in deaf than hearing only in the posterior portion of atlas-defined Heschl's. For bimodal stimulation, both visual and somatosensory attention elicited signal in atlas-defined Heschl's. Ipsi, Ipsilateral to stimulation; Contra, contralateral to stimulation.
