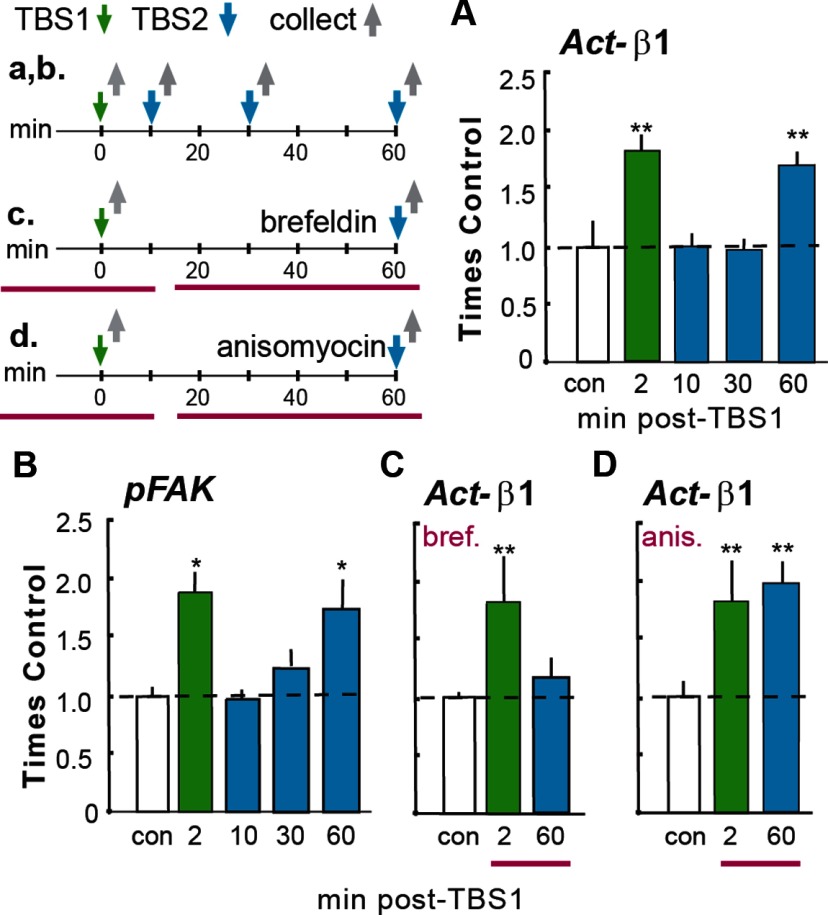
Figure 2.
Loss and recovery of integrin signaling. Time lines at top left summarize the experimental designs (time lines and associated results are denoted with lower and upper case letters, respectively). A, B, TBS was delivered twice (TBS1, TBS2) with different between-train intervals; slices were collected 2 min after the last TBS and processed for immunofluorescence. A, A single TBS train (green bar) increased numbers of PSD-95+ synapses containing immunoreactivity for Act-β1 integrin relative to counts from yoked control (con) slices given low-frequency (baseline) stimulation only. TBS2 had no effect on numbers of Act-β1+ synapses when delayed by 10 or 30 min after TBS1 but caused the normal increase in Act-β1+ synapses at 60 min (blue bars). B, Similar effects were obtained for TBS-induced increases in synaptic pFAK. C, Groups of slices were perfused (horizontal red bars in c) for 40 min with brefeldin before TBS1 or TBS2. Brefeldin had no effect on integrin activation by TBS1 but blocked that produced by TBS2. D, The design was the same as in C except that slices were treated with anisomycin. The anisomycin infusion had no effect on β1 activation by TBS1 or TBS2. ANOVA: p < 0.001 for all graphs; *p < 0.05 and **p < 0.01 vs con; ≥6 slices/group.

