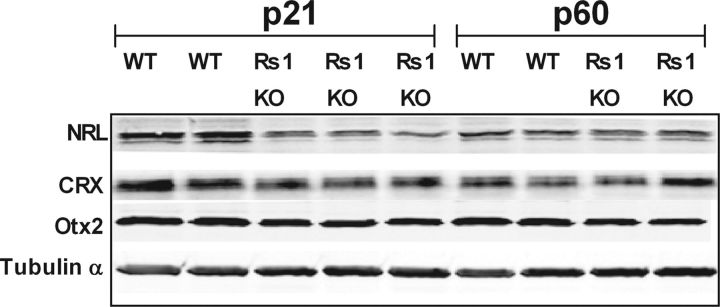
Figure 7.
Expression levels of photoreceptor-specific transcription factors. Retinal protein extracts (∼10 μg of total protein) from WT and Rs1–KO mice at ages P21 and P60 were Western blotted and probed for each of the transcription factor indicated on the left with specific antibodies, followed by anti-tubulin antibody. Expression levels were quantified using Odyssey software and normalized to α-tubulin. At P21, all of these transcription factor levels were lower (by 25–50%) in Rs1–KO mice. However, at P60, both NRL and CRX levels were comparable with that collected from WT retinas. Replicate gels were run for each antibody tested.

