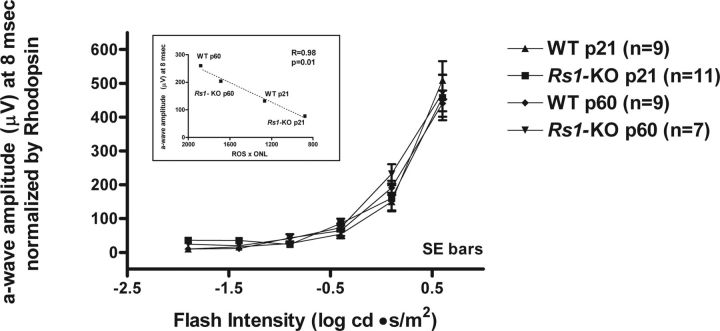
Figure 9.
Intensity–response series of scotopic ERG a-wave amplitudes in P21 and P60 WT and Rs1–KO mice measured at 8 ms after the flash. Mean ± SE amplitudes (microvolts) were normalized by the average dark-adapted whole retina rhodopsin content for each category of mice. The response curves for all groups of mice were essentially superimposed up to the maximum stimulus intensity of +0.6 log cd · s/m2. A linear correlation between the mean a-wave amplitude at 8 ms (+0.6 log cd · s/m2) and the product (ROS × ONL) calculated from the ONL widths and ROS lengths graphed in Figure 6 is displayed in the inset.

