
Figure 3.
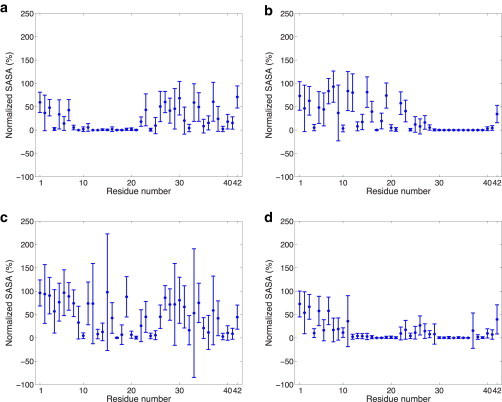
SASA of 70% helical Aβ42 residues evaluated at the dominant minima for (a) 30%/70% exo/cyto in which the C-terminus is exposed to the cytosol, (b) 40%/60% exo/cyto in which the first 28 residues of the N-terminus is solvent exposed to the exo side of the membrane, (c) no cholesterol and evaluated at the lower free energy minimum where the entire peptide is fully exposed to the membrane surface and solvent on the exo side, and (d) no cholesterol and evaluated at the relative free energy minimum where only the first 6 residues are exposed to solvent on the exo side and no exposure on the cytosol side. The SASA values were normalized by the maximum SASA values obtained for the peptide alone (i.e., without any other surrounding molecules). This enables us to differentiate between residues with low SASA due to the structure of the peptide and those with low SASA due to burial within/contact with the lipid membrane.