
Figure 6.
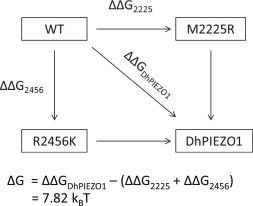
Mutant cycle analysis. The energy difference between open and inactivated states for WT, single-site mutants, and DhPIEZO1. The free energy change in DhPIEZO1 (ΔΔGDhPIEZO1) is larger than the sum of free energy changes for the two single mutants by ∼8 kBT, showing that the sites are not independent but exhibit positive cooperativity.