
Figure 5.
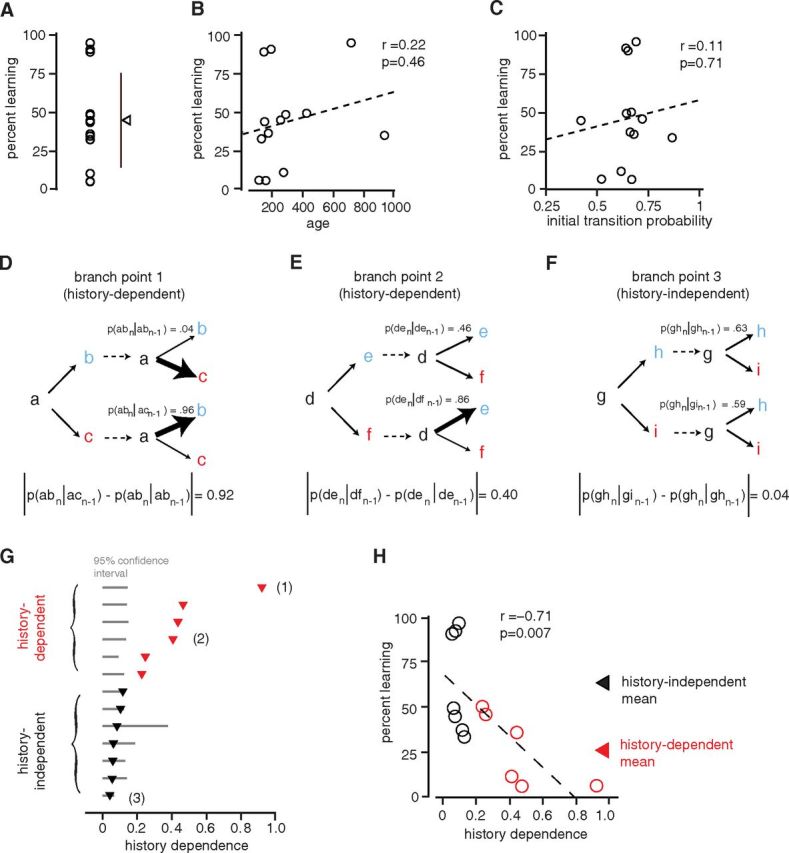
Branch points with greater history dependence are less modifiable. A, Percentage reduction in the probability of targeted transitions (“percentage learning”) for 13 branch points (triangle and bars indicate mean ± SD; n = 13 experiments in which the dominant transition was targeted). B, The age of birds at onset of WN playback was not significantly correlated with percentage learning (r = 0.22; p = 0.46). C, The initial transition probability (measured at baseline) was not significantly correlated with percentage learning (r = 0.11; p = 0.71). D–F, Three branch points illustrating varying degrees of history dependence (differences in transition probabilities at a branch point depending on which transition had occurred at the prior instance of the branch point). D shows conditional probabilities for the branch point in our study that exhibited the highest level of history dependence (branch point 1). The probability of the “ab” transition when an “ab” transition had occurred at the prior branch point, p(abn|abn−1), was 0.04. However, the probability of the “ab” transition when an “ac” transition had occurred at the prior branch point, p(abn|acn−1), was 0.96. To quantify history dependence for branch points, we computed the absolute value of the difference between these conditional transition probabilities, |p(abn|acn−1 − p(abn|abn−1)| = 0.92. E shows conditional probabilities for a branch point that exhibited less, but still significant, history dependence (branch point 2). The absolute value of the difference between conditional transition probabilities was 0.4. F shows conditional transition probabilities for a branch point that did not exhibit significant history dependence (branch point 3). The absolute value of the difference between conditional transition probabilities was 0.04. G, History dependence for 13 branch points. Data are ordered vertically according to increasing history dependence. The red triangles denote branch points for which the history dependence was significantly different from 0 (“history-dependent”; n = 6 branch points, where values fall outside 95% confidence intervals determined by resampling). Points labeled “(1),” “(2),” and “(3)” correspond to the three branch points shown in D–F. H, The history dependence of branch points was significantly correlated with observed variation in percentage learning (r = −0.71; p = 0.007). The red symbols correspond to branch points with significant history dependence. The triangles indicate means for branch points that exhibited significant history dependence (red) and for branch points that did not exhibit significant history dependence (black).