
Figure 1.
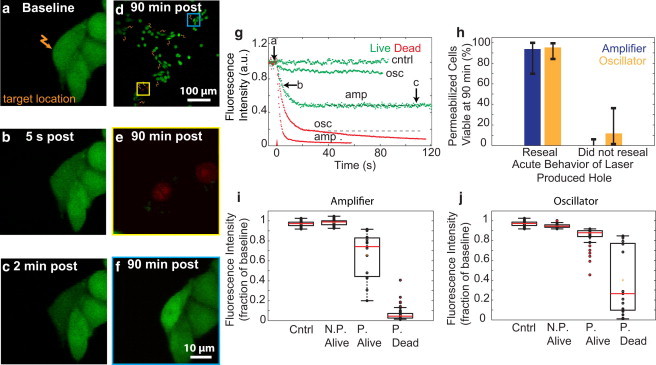
Pore formation and cell viability after femtosecond laser irradiation. (a–c) CHO cells were irradiated with femtosecond pulses (two pulses, 14 nJ) at the plasma membrane (a, arrow), and calcein fluorescence intensity (green) was monitored over time (b and c). (d) Multiple spatially separated cells were irradiated (arrows). (e) Application of calcein-AM and EtBr (red) 90 min after optoporation produced EtBr-labeled nuclei in dead cells. (f) Live cells showed no EtBr labeling and exhibited an increase in calcein fluorescence. (g) Fluorescence intensity was monitored as a function of time for cells targeted with either amplifier (amp; two pulses, 1 kHz) or oscillator (osc; 3.8 × 10⁶ pulses, 1 MHz) sources at various energies. Cells with final intensities approaching the noise floor failed to reseal (red), whereas cells with stabilized, constant intensity regained membrane integrity (green). The labeled arrows along the green trace representing amplifier optoporation correspond to the fluorescence intensity at time points of the images in a–c. (h) Cell viability at 90 min for holes that did or did not reseal acutely for optoporation with each laser source. (i and j) Fluorescence intensity after optoporation, expressed as a fraction of baseline intensity, was compared against cell permeabilization (P, permeabilized; N.P., not permeabilized) and viability for cells irradiated with the amplifier (i) or the oscillator (j). Cells with an intensity drop of 2 SDs below baseline intensity were considered permeabilized.