
Figure 3.
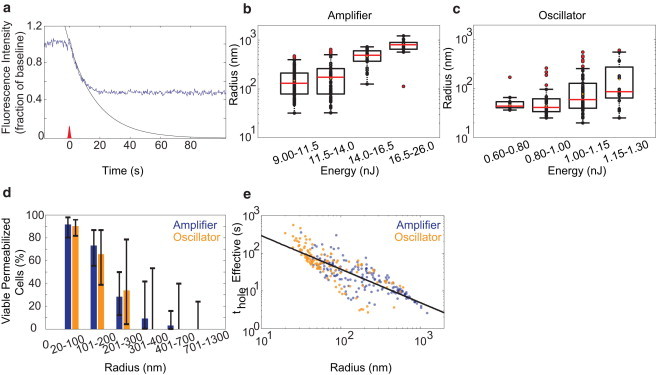
Quantification of membrane pore size and opening time. (a–c) Fitting (black curve) of the initial decay in intracellular fluorescence intensity (blue trace) after optoporation (a) was used to determine the initial radius of the membrane pore across a range of energies for both amplifier (b) and oscillator (c) pulses. (d) Plot of cell viability as a function of pore radius for both amplifier and oscillator irradiation. (e) Plot of the effective time the pore was open, thole, as a function of pore size.