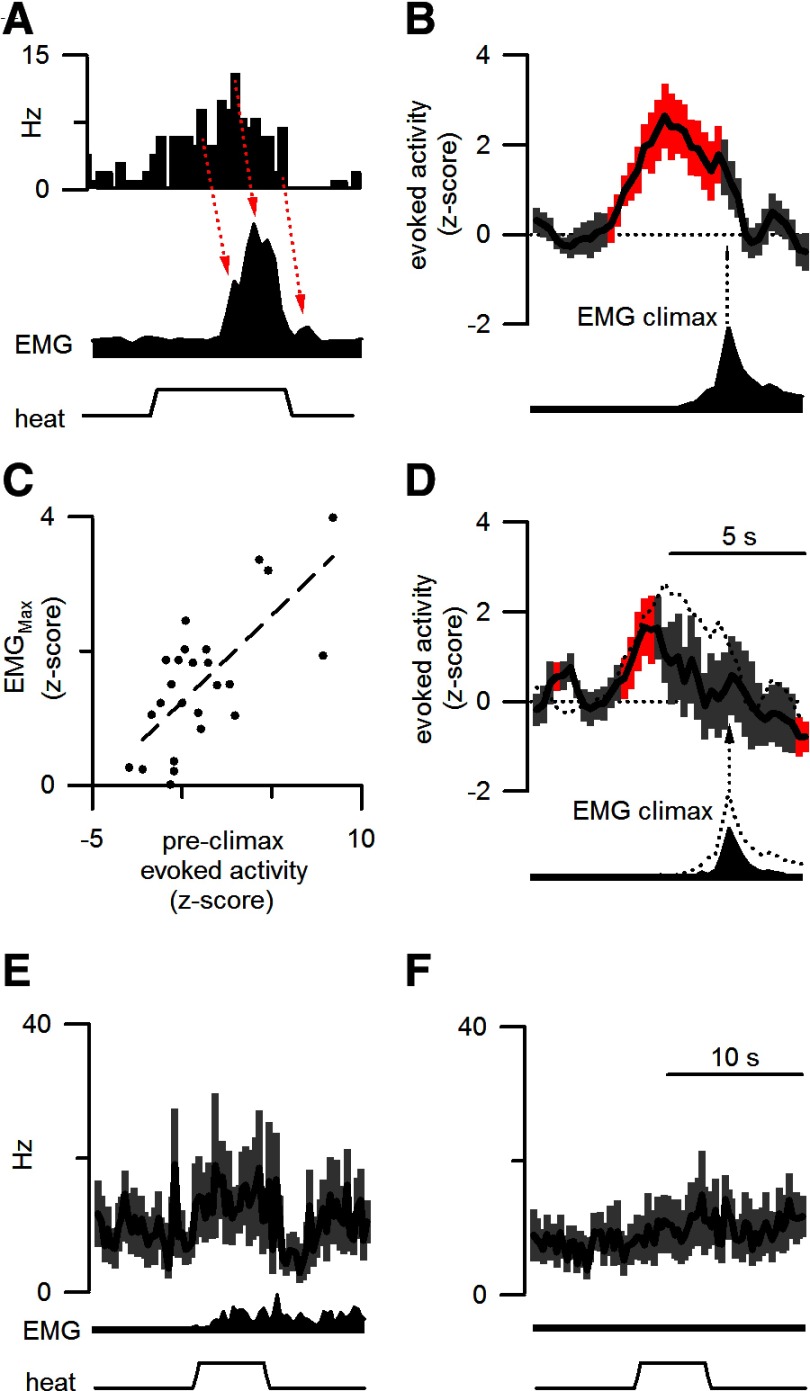
Figure 2.
The responses of ON cells to noxious stimulation predict withdrawal amplitude. A, The response to noxious stimulation of a representative ON cell peaked before local peaks in EMG activity (red arrows). B, When plotted with reference to the start of the EMG climax (arrow), normalized ON cell activity (25 responding trials from 12 ON cells in 11 mice) significantly exceeded pretrial discharge levels (red, p < 0.05 after Bonferroni's correction for multiple comparisons) before EMG climax. C, ON cell activity during the preclimactic period reliably predicted the normalized peak withdrawal magnitude. D, The normalized discharge and average EMG response during responding trials after morphine are plotted as in B. The mean cellular and motor responses before morphine are represented by the dotted lines. Data include 17 responding trials from 10 ON cells recorded from 9 mice. The time scale in D applies to A and B as well. E, F, The average firing rate (250 ms bins), after morphine administration, from 12 ON cells is plotted for heat trials that either elicited a withdrawal (17 trials from 10 cells in 9 mice, E) or failed to elicit a withdrawal (19 trials from 10 cells in 9 mice, F). As in Figure 1, the average EMG response and applied heat stimulation are shown in the lower traces. The time scale in F also applies to E.

